About kia motors corp - KIMTF
KIMTF At a Glance
| Phone | 82-2-3464-1114 | Revenue | 80.31B | |
| Industry | Motor Vehicles | Net Income | 5.32B | |
| Sector | Consumer Durables | 2025 Sales Growth | 1.928% | |
| Fiscal Year-end | 12 / 2026 | Employees | 36,566 | |
| View SEC Filings |
KIMTF Valuation
| P/E Current | N/A |
| P/E Ratio (with extraordinary items) | N/A |
| P/E Ratio (without extraordinary items) | 6.20 |
| Price to Sales Ratio | 0.411 |
| Price to Book Ratio | 0.774 |
| Price to Cash Flow Ratio | 5.18 |
| Enterprise Value to EBITDA | 2.365 |
| Enterprise Value to Sales | 0.244 |
| Total Debt to Enterprise Value | 0.097 |
KIMTF Efficiency
| Revenue/Employee | 2,196,355.859 |
| Income Per Employee | 145,492.164 |
| Receivables Turnover | 16.354 |
| Total Asset Turnover | 1.219 |
KIMTF Liquidity
| Current Ratio | 1.565 |
| Quick Ratio | 1.049 |
| Cash Ratio | 0.775 |
KIMTF Profitability
| Gross Margin | 19.83 |
| Operating Margin | 7.953 |
| Pretax Margin | 8.609 |
| Net Margin | 6.624 |
| Return on Assets | 8.078 |
| Return on Equity | 13.234 |
| Return on Total Capital | 11.99 |
| Return on Invested Capital | 12.825 |
KIMTF Capital Structure
| Total Debt to Total Equity | 4.46 |
| Total Debt to Total Capital | 4.27 |
| Total Debt to Total Assets | 2.757 |
| Long-Term Debt to Equity | 2.113 |
| Long-Term Debt to Total Capital | 2.023 |
Kia Motors Corp in the News

Americans shift to more affordable cars as prices, insurance costs increase nationally: report
American consumers are voting with their dollar at car dealerships nationwide, where both average car costs and average insurance rates have spiked in 2024.

Kia recalls 460K Telluride SUVs over fire risk; urges owners to 'park outside'
Kia is recalling over 460,000 Tellurides made between 2020 and 2024, which could catch fire if a power-seat motor overheats, either in park or while driving on the road.

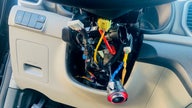
Seattle Kia owner leaves car at dealership after being fed up with constant break-ins
A Kia owner in Seattle got so fed up with his car being targeted by thieves that he decided to dump the vehicle off at the dealership where he bought it and walk home.
Cities sue Hyundai, Kia after wave of car thefts
At least eight U.S. cities have sued Kia and Hyundai for failing to install anti-theft technologies, which has led to a surge in auto theft and destruction.

Milwaukee becomes latest city to sue Kia, Hyundai over rampant thefts
Milwaukee becomes the latest city to announce a lawsuit against South Korean automakers Kia and Hyundai over rash of vehicle thefts, resulting in higher costs of fighting crime.
Major insurers plan to drop two car models' coverage due to thefts: report
State Farm and Progressively are reportedly not writing new insurance policies for some models and years of Kia and Hyundai vehicles because of a rise in thefts.
Kia recalls 72,000 Sportage models, says park outside due to engine fire risk
Kia Sportages are being recalled for a second time over what the National Highway Traffic Safety Administration is calling a fire risk in the engine area.

South Korea says US pledged to review EV subsidies included in Inflation Reduction Act
The U.S. has pledged to review EV subsidies included in the Inflation Reduction Act after South Korea raised concerns over the potential impact on its domestic manufacturing.
Hyundai, Kia recall 600,000 vehicles to fix trunk latch problem
Hyundai and Kia are recalling more than 600,000 vehicles in the U.S. because damage to the trunk latches can stop them from being opened from the inside.
Kia recalls vehicles a 2nd time, owners should park outside
Kia is recalling more than 440,000 cars and SUVs in the U.S. for a second time to fix a problem that can cause engine fires. And the automaker is telling owners to park them outdoors and away from structures because fires could happen when the engines aren’t running.