About beyond meat inc. - BYND
BYND At a Glance
| Phone | 1-866-756-4112 | Revenue | 275.50M | |
| Industry | Food: Major Diversified | Net Income | 178.01M | |
| Sector | Consumer Non-Durables | Employees | 589 | |
| Fiscal Year-end | 12 / 2026 | |||
| View SEC Filings |
BYND Valuation
| P/E Current | N/A |
| P/E Ratio (with extraordinary items) | N/A |
| P/E Ratio (without extraordinary items) | N/A |
| Price to Sales Ratio | 0.538 |
| Price to Book Ratio | N/A |
| Price to Cash Flow Ratio | N/A |
| Enterprise Value to EBITDA | -2.234 |
| Enterprise Value to Sales | 1.626 |
| Total Debt to Enterprise Value | 1.134 |
BYND Efficiency
| Revenue/Employee | 467,735.144 |
| Income Per Employee | 302,227.504 |
| Receivables Turnover | 10.572 |
| Total Asset Turnover | 0.426 |
BYND Liquidity
| Current Ratio | 4.558 |
| Quick Ratio | 3.436 |
| Cash Ratio | 2.78 |
BYND Profitability
| Gross Margin | -0.092 |
| Operating Margin | -84.70 |
| Pretax Margin | 79.53 |
| Net Margin | 64.615 |
| Return on Assets | 27.537 |
| Return on Equity | N/A |
| Return on Total Capital | 35.113 |
| Return on Invested Capital | 31.869 |
BYND Capital Structure
| Total Debt to Total Equity | N/A |
| Total Debt to Total Capital | 100.197 |
| Total Debt to Total Assets | 82.631 |
| Long-Term Debt to Equity | N/A |
| Long-Term Debt to Total Capital | 98.911 |
Beyond Meat Inc. in the News
Burger King brings back fan favorite for the first time in 15 years
Burger King brings back Crown Nuggets after 15 years, answering fan demands for the nostalgic crown-shaped chicken nuggets starting June 2 nationwide.

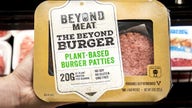
Beyond Meat, Walmart and a MEME ETF
Walmart and Roundhill Investments MEME ETF created big headlines for Beyond Meat, spiking the stock, which had been left for dead after hitting a record low earlier this month.

Impossible Foods CEO chews out Bloomberg article arguing fake meat is just a 'fad'
Impossible Burger CEO Peter McGuinness shared the company's response to claims from Bloomberg that plant-based meat is a fad on 'The Claman Countdown.'

Bill Gates says fake meat products will 'eventually' be 'very good'
Microsoft co-founder turner philanthropist Bill Gates said he is hopeful that fake meat products will eventually be a "very good" option for consumers even though the share of products on the market are small.

Election reaction, Disney slips and more: Wednesday's 5 things to know
The balance of power is till being decided early Wednesday however there were major victories by Ron DeSantis, John Fetterman and J.D. Vance.
Plant-based meat sales declining, industry possibly suffering 'perception problem'
Plant-based meat sales declining, industry appears to be suffering from "woke" perception problem, according to report. Just last week Beyond Meat announced it suspended COO Doug Ramsey.

Panda Express, Beyond Meat bring back plant-based orange chicken to restaurants nationwide
Panda Express and Beyond Meat are bringing their Beyond The Original Orange Chicken collaboration to restaurants nationwide for a limited time after two successful tests.
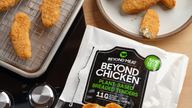
Beyond Meat expands chicken tenders to over 8,000 retailers
Beyond Chicken Tenders are now available at 8,000 retailers across the U.S.
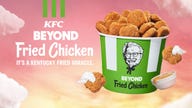
KFC, Beyond Meat chicken rollout on tap
Beyond Meat and KFC are teaming up to offer Beyond Fried Chicken, the chain’s first-ever plant-based combo meal.
McDonald’s to test McPlant Burger in US for 1st time
Americans are finally going to get a taste of the McPlant Burger as McDonald’s rolls out tests for the pea protein-based sandwich in four U.S. states.