Company Overview: mondelez international inc. - MDLZ
MDLZ Key Data
| Open $61.53 | Day Range 61.39 - 62.38 |
| 52 Week Range 51.20 - 71.15 | Market Cap $78.38B |
| Shares Outstanding 1.28B | Public Float 1.28B |
| Beta 0.40 | Rev. Per Employee N/A |
| P/E Ratio 30.27 | EPS $2.02 |
| Yield 322.63% | Dividend $0.50 |
| EX-DIVIDEND DATE Jun 30, 2026 | SHORT INTEREST N/A |
| AVERAGE VOLUME 9.23M |
Mondelez International Inc. in the News

Ritz crackers recalled in 8 states over life-threatening peanut allergy risk from mislabeling
Ritz peanut butter crackers recalled in eight states after dangerous labeling mix-up could trigger severe allergic reactions in peanut allergy sufferers.

Major food brands turn to smaller package sizes to win over today's consumers
Companies like Mondelēz and Campbell's are innovating with smaller package sizes to maintain brand relevance as consumers become more cautious with spending and focused on health.

Popular Ritz snack pulled from shelves nationwide over dangerous peanut allergy mislabeling
Mondelez Global is recalling some cartons of Ritz cracker sandwiches over erroneous labeling on their packaging that could put people allergic or sensitive to peanuts at risk.

Halloween candy aisles see shift amid sky-high cocoa prices
The soaring price of cocoa over the past year has pushed up the cost of chocolate, leading candy companies and consumers to lean toward other options this Halloween.
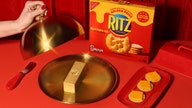
Butter lovers to have new Ritz cracker offering in limited-edition flavor, plus gold-bar opportunity
Ritz has announced a new limited-edition "Buttery-er Flavored Crackers" snack offering, which hits store shelves April 29, 2024 — along with a contest starting May 1 to win a 24-karat gold bar.

Valentine's Day chocolates set to break hearts after cocoa prices hit record high
A shortage of cocoa due to crop damage in West Africa drove the price to a record high last week, just ahead of the Valentine's Day holiday as consumers feel the squeeze.

OREO announces first-of-its-kind puffer ‘snacket’ so cookie lovers can store, grab and share snacks
OREO announced a new test clothing item: the puffer "snacket," which allows for easy store-and-grab cookie snacking straight from the bright blue winter coat.
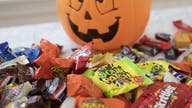
Halloween candy prices surge nearly 13% from last October
The cost of candy for this year's Halloween has soared roughly 13% from October 2022 — more than twice the amount of inflation for other groceries, according to new data.
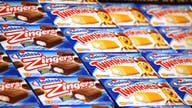
Hostess Brands exploring sale as Twinkies, other products may find new home: report
Hostess Brands, the company behind Twinkies and Zingers, is considering a potential sale amid interest from food industry giants, according to a report by Reuters.
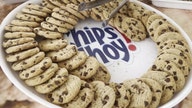
Chips Ahoy! turns 60: Fun facts about the American cookie brand and its history
American cookie brand Chips Ahoy! was found in 1963 and is celebrating its 60th anniversary. Here are 10 interesting facts about the cookie brand, parent company and more.