About carnival corp. ltd. - CCL
CCL At a Glance
| Phone | 1-305-599-2600 | Revenue | 26.62B | |
| Industry | Hotels/Resorts/Cruise lines | Net Income | 2.76B | |
| Sector | Consumer Services | 2025 Sales Growth | 6.399% | |
| Fiscal Year-end | 11 / 2026 | Employees | N/A | |
| View SEC Filings |
CCL Valuation
| P/E Current | 12.769 |
| P/E Ratio (with extraordinary items) | N/A |
| P/E Ratio (without extraordinary items) | 12.767 |
| Price to Sales Ratio | 1.358 |
| Price to Book Ratio | 2.753 |
| Price to Cash Flow Ratio | 5.81 |
| Enterprise Value to EBITDA | 8.665 |
| Enterprise Value to Sales | 2.336 |
| Total Debt to Enterprise Value | 0.45 |
CCL Efficiency
| Revenue/Employee | N/A |
| Income Per Employee | N/A |
| Receivables Turnover | 39.265 |
| Total Asset Turnover | 0.529 |
CCL Liquidity
| Current Ratio | 0.295 |
| Quick Ratio | 0.256 |
| Cash Ratio | 0.15 |
CCL Profitability
| Gross Margin | 29.205 |
| Operating Margin | 16.475 |
| Pretax Margin | 10.412 |
| Net Margin | 10.367 |
| Return on Assets | 5.479 |
| Return on Equity | 25.633 |
| Return on Total Capital | 6.853 |
| Return on Invested Capital | 7.467 |
CCL Capital Structure
| Total Debt to Total Equity | 227.882 |
| Total Debt to Total Capital | 69.501 |
| Total Debt to Total Assets | 54.159 |
| Long-Term Debt to Equity | 205.267 |
| Long-Term Debt to Total Capital | 62.604 |
Carnival Corp. Ltd. in the News

Coast Guard pauses search after crew member falls overboard from Norwegian Cruise ship
The Coast Guard has paused its search for a Norwegian Breakaway crew member seen falling overboard on security video near Wellfleet, Massachusetts.

Cruise lines face fuel cost surge as oil prices jump on Iran tensions
Cruise lines face rising fuel costs as oil prices surge 35% during the Iran conflict, threatening profits during peak booking season for summer trips.

CDC releases list of 2024's least sanitary cruise ships: Have you been on one?
The Vessel Sanitation Program with the CDC selects and inspects cruise ships at random if they have a foreign itinerary, a U.S. port and more than 13 passengers.

Alaska increases cruise tourism limits as residents argue peace of mind versus economy
Overtourism has grown into a contentious issue for many cities as they emerged from the pandemic lockdown and handled the surge of travel that followed it.

Royal Caribbean set to resume cruises out of Baltimore nearly 2 months after Key Bridge collapse
Royal Caribbean announced it would be resuming cruises out of Baltimore, Maryland beginning on May 25, 2024, following the collapse of the Francis Scott Key Bridge.
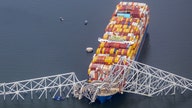
Carnival says Baltimore bridge collapse could bring up to $10M earnings impact in 2024
Carnival Corporation said Wednesday the Francis Scott Key Bridge collapse in Maryland could have a negative effect on its full-year earnings to the tune of up to $10 million.
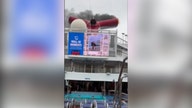
Cruises canceled following Carnival Freedom fire during busy spring break season
Two cruises have been canceled during the busy spring break season following a fire on the Carnival Freedom, the cruise line announced.
Carnival Freedom cruise ship catches fire for second time in less than 2 years
Carnival Freedom continued on its current cruise itinerary after experiencing its second fire in less than two years, caught on passenger video Saturday.

Carnival Jubilee cruise ship rescues 2 men stranded in Gulf of Mexico
The Carnival Jubilee cruise ship has rescued two men stranded in a kayak in the Gulf of Mexico after the boat they were traveling in reportedly sank.

Carnival cruise crew members help rescue 12 people from ocean after cargo vessel capsizes
Crew members from a Carnival cruise ship assisted in rescuing six men from the ocean near the Dominican Republic, and alerted the Coast Guard to six more.