About merck & co. inc. - MRK
MRK At a Glance
| Phone | 1-908-740-4000 | Revenue | 65.01B | |
| Industry | Pharmaceuticals: Major | Net Income | 18.25B | |
| Sector | Health Technology | 2025 Sales Growth | 1.623% | |
| Fiscal Year-end | 12 / 2026 | Employees | N/A | |
| View SEC Filings |
MRK Valuation
| P/E Current | 16.446 |
| P/E Ratio (with extraordinary items) | N/A |
| P/E Ratio (without extraordinary items) | 14.456 |
| Price to Sales Ratio | 4.059 |
| Price to Book Ratio | N/A |
| Price to Cash Flow Ratio | N/A |
| Enterprise Value to EBITDA | N/A |
| Enterprise Value to Sales | N/A |
| Total Debt to Enterprise Value | N/A |
MRK Efficiency
| Revenue/Employee | N/A |
| Income Per Employee | N/A |
| Receivables Turnover | N/A |
| Total Asset Turnover | N/A |
MRK Liquidity
| Current Ratio | N/A |
| Quick Ratio | N/A |
| Cash Ratio | N/A |
MRK Profitability
| Gross Margin | 81.50 |
| Operating Margin | 41.191 |
| Pretax Margin | 32.405 |
| Net Margin | 28.078 |
| Return on Assets | N/A |
| Return on Equity | N/A |
| Return on Total Capital | N/A |
| Return on Invested Capital | N/A |
MRK Capital Structure
| Total Debt to Total Equity | N/A |
| Total Debt to Total Capital | N/A |
| Total Debt to Total Assets | N/A |
| Long-Term Debt to Equity | N/A |
| Long-Term Debt to Total Capital | N/A |
Merck & Co. Inc. in the News

Top 5 most expensive drugs for consumers
Five top-selling drugs, in some cases, are costing Americans thousands in out of pocket expenses weekly and monthly. Here's the list.

Merck breaks ground on $3B manufacturing plant in Virginia
Merck is breaking ground on a new 400,000-square-foot manufacturing facility in Elkton, Virginia, as part of its $70 billion U.S. investment strategy.

Blockbuster long acting flea and tick treatment for dogs coming after FDA approval
A long-acting flea and tick treatment from Merck Animal Health has earned approval for dogs at least six months old from the Food and Drug Administration (FDA).

President Donald Trump's first 100 days: Companies that will invest $1B or more in the US
As President Donald Trump hits 100 days in his second term, the administration is touting the billions of investments companies such as Apple and Merck are making in the United States

Coalition calls on Congress to repeal Biden's prescription drug price controls
More than 40 groups have signed onto a letter asking Congress to end the prescription drug price control scheme included in the Inflation Reduction Act.
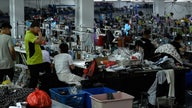
AI helping remove Chinese goods made with Uyghur forced labor from corporate supply chains
Altana Technologies developed an AI-informed supply chain mapping system used by Customs and Border Protection and a number of firms to root out Uyghur forced labor from supply chains.

Corporate diversity policies may face scrutiny after Supreme Court's affirmative action ruling
The Supreme Court's ruling rejecting the use of affirmative action and consideration of race as a factor in college admissions could prompt challenges to companies' diversity programs.
LARRY KUDLOW: Biden's op-ed on the economy is chock full of Pinocchios
FOX Business host Larry Kudlow dissects the 'untruths' in President Biden's Wall Street Journal op-ed in his opening monologue on 'Kudlow.'

Merck sues Biden HHS for drug price-fixing 'sham' it says would cripple pharmaceutical industry
Pharmaceutical company Merck has filed a lawsuit against the Biden administration for a new drug pricing program it says is an unconstitutional "sham."

India set to release newly developed cervical cancer vaccine soon
The Serum Institute of India (SII) has recently announced that they have successfully developed the world's first cervical cancer vaccine, which will soon hit shelves soon.