About sentinelone inc - S
S At a Glance
| Phone | 1-855-868-3733 | Revenue | 1.00B | |
| Industry | Packaged Software | Net Income | -450,735,000.00 | |
| Sector | Technology Services | 2026 Sales Growth | 21.89% | |
| Fiscal Year-end | 01 / 2027 | Employees | 2,900 | |
| View SEC Filings |
S Valuation
| P/E Current | N/A |
| P/E Ratio (with extraordinary items) | N/A |
| P/E Ratio (without extraordinary items) | N/A |
| Price to Sales Ratio | 4.609 |
| Price to Book Ratio | 3.286 |
| Price to Cash Flow Ratio | 60.23 |
| Enterprise Value to EBITDA | -15.946 |
| Enterprise Value to Sales | 3.974 |
| Total Debt to Enterprise Value | 0.004 |
S Efficiency
| Revenue/Employee | 345,268.276 |
| Income Per Employee | -155,425.862 |
| Receivables Turnover | 3.464 |
| Total Asset Turnover | 0.413 |
S Liquidity
| Current Ratio | 1.295 |
| Quick Ratio | 1.295 |
| Cash Ratio | 0.861 |
S Profitability
| Gross Margin | 73.176 |
| Operating Margin | -30.406 |
| Pretax Margin | -27.935 |
| Net Margin | -45.016 |
| Return on Assets | -18.607 |
| Return on Equity | -29.02 |
| Return on Total Capital | -31.039 |
| Return on Invested Capital | -28.808 |
S Capital Structure
| Total Debt to Total Equity | 1.044 |
| Total Debt to Total Capital | 1.033 |
| Total Debt to Total Assets | 0.615 |
| Long-Term Debt to Equity | 0.634 |
| Long-Term Debt to Total Capital | 0.627 |
Sentinelone Inc in the News

Could the Vanguard S&P 500 ETF be your ticket to becoming a stock market millionaire?
The Vanguard S&P 500 ETF made stock market history as the first ETF to hit $1 trillion in assets, offering diversified exposure to 500 of the largest U.S. companies.

A beginner-friendly ETF portfolio that requires almost no maintenance and delivers long-term results
For a portfolio to count as being both good and easy, it needs to be anchored with a hearty helping of stock market-tracking index funds.

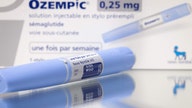
Novo Nordisk to slash list prices of Ozempic, Wegovy by up to 50%
Novo Nordisk announced up to 50% price cuts for Ozempic and Wegovy diabetes and weight-loss drugs starting January 2027, lowering costs to $675 per dose.
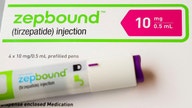
Eli Lilly cuts Zepbound prices in competitive weight loss drug market battle
Eli Lilly will cut prices for its weight loss drug Zepbound, with single-dose vials now available for $299 per month through its LillyDirect platform.

Costco members will soon have access to weight-loss shots at a major discount
Costco is partnering with the healthcare company Novo Nordisk to give members access to GLP-1 medications at just $499 for a four-week supply.
Novo Nordisk to sell weight-loss drug for $499 to eligible customers
Cash-paying type 2 diabetes patients in the United States can now access Novo Nordisk's Ozempic for $499 per month through multiple pharmacy platforms.

Novo Nordisk CEO steps down as Wegovy maker faces increased competition
As Novo Nordisk's share price drops, CEO Lars Fruergaard Jorgensen steps down. The company aims to maintain its lead in the competitive weight-loss drug market.

Stablecoin bill, originally bipartisan, hits snag as Dems splinter
Sen. Bill Hagerty is spearheading legislation to regulate stablecoin, a cryptocurrency linked to fiat currencies like the dollar, but he has hit a snag.

Hims & Hers partners with Novo Nordisk to sell Wegovy
Hims & Hers on Tuesday announced a collaboration with drugmaker Novo Nordisk to bundle Wegovy and a Hims & Hers membership on its telehealth platform.

Pfizer will end development of daily weight-loss pill after liver injury
Pfizer is facing another setback with its weight-loss pill, danuglipron. The pharmaceutical giant stopped development of the drug after liver issues affected one patient.