About nintendo co. ltd. - NTDOY
NTDOY At a Glance
| Phone | 81-75-662-9600 | Revenue | 15.35B | |
| Industry | Recreational Products | Net Income | 2.81B | |
| Sector | Consumer Durables | 2026 Sales Growth | 100.875% | |
| Fiscal Year-end | 03 / 2027 | Employees | N/A | |
| View SEC Filings |
NTDOY Valuation
| P/E Current | 18.207 |
| P/E Ratio (with extraordinary items) | N/A |
| P/E Ratio (without extraordinary items) | 23.632 |
| Price to Sales Ratio | 4.332 |
| Price to Book Ratio | 3.549 |
| Price to Cash Flow Ratio | 34.58 |
| Enterprise Value to EBITDA | N/A |
| Enterprise Value to Sales | N/A |
| Total Debt to Enterprise Value | N/A |
NTDOY Efficiency
| Revenue/Employee | N/A |
| Income Per Employee | N/A |
| Receivables Turnover | 16.563 |
| Total Asset Turnover | 0.658 |
NTDOY Liquidity
| Current Ratio | 3.959 |
| Quick Ratio | 3.249 |
| Cash Ratio | 2.916 |
NTDOY Profitability
| Gross Margin | 39.297 |
| Operating Margin | 15.569 |
| Pretax Margin | 24.565 |
| Net Margin | 18.333 |
| Return on Assets | 12.066 |
| Return on Equity | 15.299 |
| Return on Total Capital | N/A |
| Return on Invested Capital | N/A |
NTDOY Capital Structure
| Total Debt to Total Equity | N/A |
| Total Debt to Total Capital | N/A |
| Total Debt to Total Assets | N/A |
| Long-Term Debt to Equity | N/A |
| Long-Term Debt to Total Capital | N/A |
Nintendo Co. Ltd. in the News

Sony slashes PS5 prices as Nintendo and Xbox hike console costs
Playstation 5 sees price cuts as Sony's Days of Play 2025 begins, offering deals amid Nintendo Switch 2 release and Xbox price increases. Save on PS5 bundle and accessories.
Nintendo to announce new console by March 2025, company says
Nintendo has announced plans to unveil the successor to its Switch console by March 2025. The company noted the evolving complexity of game development since the Switch's launch.

Microsoft reaches deal to keep 'Call of Duty' franchise available on PlayStation
Microsoft announced Sunday that the company reached a deal with Sony to keep the "Call of Duty" franchise available on PlayStation consoles after its Activision Blizzard acquisition.

Nintendo's profits decline following last year's pandemic boost
Japanese video game maker Nintendo's profit dropped 19% in the first half of its fiscal year from the previous year, when it received a big lift as people stuck at home by the coronavirus pandemic turned to its products.

Super Nintendo World Japan adding Donkey Kong-themed expansion
Mario and Donkey Kong are about to be reunited again.
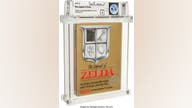
Unopened 'Legend of Zelda' game from 1987 sells for $870,000
An unopened copy of Nintendo’s The Legend of Zelda that was made in 1987 has sold at auction for $870,000.