About norfolk southern corp. - NSC
NSC At a Glance
| Phone | 1-855-667-3655 | Revenue | 12.18B | |
| Industry | Railroads | Net Income | 2.87B | |
| Sector | Transportation | 2025 Sales Growth | 0.47% | |
| Fiscal Year-end | 12 / 2026 | Employees | 19,300 | |
| View SEC Filings |
NSC Valuation
| P/E Current | 25.636 |
| P/E Ratio (with extraordinary items) | N/A |
| P/E Ratio (without extraordinary items) | 22.649 |
| Price to Sales Ratio | 5.341 |
| Price to Book Ratio | 4.168 |
| Price to Cash Flow Ratio | 14.92 |
| Enterprise Value to EBITDA | 15.224 |
| Enterprise Value to Sales | 6.68 |
| Total Debt to Enterprise Value | 0.219 |
NSC Efficiency
| Revenue/Employee | 631,088.083 |
| Income Per Employee | 148,704.663 |
| Receivables Turnover | 12.328 |
| Total Asset Turnover | 0.272 |
NSC Liquidity
| Current Ratio | 0.847 |
| Quick Ratio | 0.775 |
| Cash Ratio | 0.405 |
NSC Profitability
| Gross Margin | 32.438 |
| Operating Margin | 32.438 |
| Pretax Margin | 30.09 |
| Net Margin | 23.563 |
| Return on Assets | 6.398 |
| Return on Equity | 19.228 |
| Return on Total Capital | 8.596 |
| Return on Invested Capital | 8.914 |
NSC Capital Structure
| Total Debt to Total Equity | 114.742 |
| Total Debt to Total Capital | 53.433 |
| Total Debt to Total Assets | 39.118 |
| Long-Term Debt to Equity | 110.388 |
| Long-Term Debt to Total Capital | 51.405 |
Norfolk Southern Corp. in the News

Norfolk Southern fires CEO over 'consensual relationship' with chief legal officer
Norfolk Southern CEO Alan Shaw has been fired by the railroad, along with Chief Legal Officer Nabanita Nag, after an investigation found the two engaged in a "consensual relationship."
Norfolk Southern agrees to $600 million settlement for East Palestine train derailment
Norfolk Southern announced a $600 million agreement with residents and businesses of East Palestine, Ohio to settle a class action lawsuit over the February 2023 train derailment.
Norfolk Southern CEO received major pay boost despite East Palestine derailment
Norfolk Southern CEO Alan Shaw received significant pay raise last year despite the disastrous derailment in East Palestine, Ohio, and calls for him to be fired.

Cost associated with Norfolk Southern's Ohio derailment more than doubles to $803 million
Norfolk Southern recorded another $416 million in charges related to the fiery derailment in East Palestine, Ohio. The total cost of the derailment is currently $803 million.
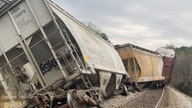
Norfolk Southern train derails in Pennsylvania, no hazardous materials spilled
A Norfolk Southern train derailed in Pennsylvania late Wednesday night. Officials said no hazardous materials were involved in the incident and no one was injured.

‘Hurry up and get it done’: Norfolk Southern set railcar safety checks at one minute
Norfolk Southern’s practices are a prime focus of federal regulators after several major accidents since December 2021, three of which resulted in fatalities.
Norfolk Southern train derails in Alabama just before CEO testifies
A Norfolk Southern train derailed in Alabama early Thursday morning as the rail operator's CEO Alan Shaw appeared before Congress. There were no injuries and no reported hazardous leaks.

Ohio first responder calls decision to do 'controlled release' of 5 tank cars instead of 1 'jaw-dropping'
A first responder testifying about the Norfolk Southern toxic train derailment in Ohio says the decision to vent and burn five tank cars instead of one widened the “impact” area.

Moment Norfolk Southern train derails in Ohio caught on dashcam video
A new video has captured the moment a Norfolk Southern train carrying fuel derailed in Springfield Township, Ohio, between Dayton and Columbus.

Norfolk Southern announces 6-point safety plan in wake of Ohio toxic train derailment
Norfolk Southern says it’s launching “meaningful safety improvements” to its rail network Monday following an NTSB report into the Feb. 3 Ohio toxic train derailment.