About nissan motor co. ltd. - NSANY
NSANY At a Glance
| Phone | 81-45-523-5523 | Revenue | 79.68B | |
| Industry | Motor Vehicles | Net Income | -3,537,644,330.85 | |
| Sector | Consumer Durables | Employees | N/A | |
| Fiscal Year-end | 03 / 2027 | |||
| View SEC Filings |
NSANY Valuation
| P/E Current | N/A |
| P/E Ratio (with extraordinary items) | N/A |
| P/E Ratio (without extraordinary items) | N/A |
| Price to Sales Ratio | 0.092 |
| Price to Book Ratio | 0.243 |
| Price to Cash Flow Ratio | 1.39 |
| Enterprise Value to EBITDA | 11.391 |
| Enterprise Value to Sales | 0.652 |
| Total Debt to Enterprise Value | 1.08 |
NSANY Efficiency
| Revenue/Employee | 663,604.197 |
| Income Per Employee | -29,460.974 |
| Receivables Turnover | 1.612 |
| Total Asset Turnover | 0.633 |
NSANY Liquidity
| Current Ratio | 1.56 |
| Quick Ratio | 1.36 |
| Cash Ratio | 0.279 |
NSANY Profitability
| Gross Margin | 12.381 |
| Operating Margin | 0.483 |
| Pretax Margin | -3.667 |
| Net Margin | -4.44 |
| Return on Assets | -2.81 |
| Return on Equity | -11.173 |
| Return on Total Capital | -4.102 |
| Return on Invested Capital | -5.595 |
NSANY Capital Structure
| Total Debt to Total Equity | 185.875 |
| Total Debt to Total Capital | 65.02 |
| Total Debt to Total Assets | 45.023 |
| Long-Term Debt to Equity | 110.833 |
| Long-Term Debt to Total Capital | 38.77 |
Nissan Motor Co. Ltd. in the News

Nissan recalls over 51K SUVs after software defect causes dashboard screens to fail
Nissan recalls over 51,000 Kicks SUVs due to a software defect that can cause dashboard displays to go blank, hiding critical safety warnings.

Nissan recalling over 26,000 vehicles due to door issue that could increase risk of crash
Nissan had announced a voluntary recall for 26,432 vehicles to fix an issue with door components that could cause the door to unintentionally open while driving or during a crash.

Nissan increases job cuts to 20K by 2027
Japanese automaker Nissan expanded its planned job cuts after seeing a "challenging" FY 2024. The company is also working to mitigate the impact of President Donald Trump's tariffs.

Nissan, Honda announce plans to consider merger
Nissan and Honda agreed to consider a merger and set up a joint holding company, which would create the world's third-largest automaker.
Nissan to cut 9K jobs, reduce CEO's monthly pay by 50% as company faces 'severe situation'
Nissan is cutting jobs and its CEO's pay after results from the first half of FY24 showed decreased consolidated net revenue and global sales volumes, and a .5% operating profit margin.
US tells owners to stop driving older Nissan vehicles over air bag concerns
Nissan and the NHTSA are warning drivers of older Nissan vehicles that still have recalled Takata air bags not to drive until the air bags are repaired and replaced due to safety risks.
Nissan to launch 30 new models by 2027, reduce cost of EVs
Nissan is seeking to drive more profitability over the medium-term through a new plan. It involves 30 new models and a unit sale increase of 1 million in the next three years.
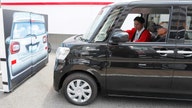
Toyota subsidiary shuts down production after admitting to decades of safety test 'irregularities'
Toyota bought a majority share in Daihatsu in 1967 and expanded that to a controlling interest in 1998 after the company failed to make an impact in the North American market.
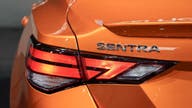
Nissan recalling 236k Sentras over possible steering control problem
About 236,000 Nissan Sentras from model years 2020 through 2022 are being recalled over a problem that could cause drivers to lose steering control.
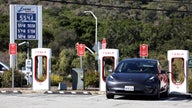
Electric car searches double amid gas price spike
Interest in electric cars has more than doubled since the Russian invasion of Ukraine sent oil prices into record territory, according to new data from Cars.com.