About hertz global - HTZ
HTZ At a Glance
| Phone | 1-239-301-7000 | Revenue | 8.50B | |
| Industry | Finance/Rental/Leasing | Net Income | -747,000,000.00 | |
| Sector | Finance | Employees | 26,000 | |
| Fiscal Year-end | 12 / 2026 | |||
| View SEC Filings |
HTZ Valuation
| P/E Current | N/A |
| P/E Ratio (with extraordinary items) | N/A |
| P/E Ratio (without extraordinary items) | N/A |
| Price to Sales Ratio | 0.187 |
| Price to Book Ratio | N/A |
| Price to Cash Flow Ratio | 0.98 |
| Enterprise Value to EBITDA | 8.333 |
| Enterprise Value to Sales | 2.308 |
| Total Debt to Enterprise Value | 0.978 |
HTZ Efficiency
| Revenue/Employee | 327,076.923 |
| Income Per Employee | -28,730.769 |
| Receivables Turnover | 7.661 |
| Total Asset Turnover | 0.386 |
HTZ Liquidity
| Current Ratio | 0.553 |
| Quick Ratio | 0.553 |
| Cash Ratio | 0.211 |
HTZ Profitability
| Gross Margin | 12.171 |
| Operating Margin | 1.058 |
| Pretax Margin | -9.76 |
| Net Margin | -8.784 |
| Return on Assets | -3.387 |
| Return on Equity | N/A |
| Return on Total Capital | -3.987 |
| Return on Invested Capital | -4.403 |
HTZ Capital Structure
| Total Debt to Total Equity | N/A |
| Total Debt to Total Capital | 102.45 |
| Total Debt to Total Assets | 86.043 |
| Long-Term Debt to Equity | N/A |
| Long-Term Debt to Total Capital | 84.785 |
Hertz Global in the News

Hertz, Uber team up to build robotaxi fleets in major mobility push
Hertz teams with Uber to manage robotaxi fleets and driver operations, signaling a shift toward centrally managed transportation networks.
Trump's auto tariffs could be boon for rental car companies
FOX Business correspondent Madison Alworth reported that President Donald Trump’s recently announced auto tariffs could be a boon to rental car companies.
Hertz says it lost another $195M from EV bet
Hertz Global reported higher-than-expected quarterly losses on Thursday, which sent shares down by more than 24%. The company's total losses were $588 million.

Hertz CEO Stephen Scherr resigns after EV push goes bust
Hertz CEO Stephen Scherr is resigning after the car rental company's investment in electrical vehicles failed over high costs and low demand.

Winter weather presenting EV owners with 'frustrating' challenges
Electric vehicle drivers shared their frustrations after winter weather across the U.S. created new issues for charging and operating their cars.
White House praised Hertz for 'accelerating the EV transition' months before company began dumping EVs
Months before Hertz's surprise announcement that it would sell-off much of its electric vehicles, the White House praised the company's green efforts.
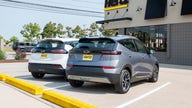
Hertz selling 20,000 EVs from fleet, to reinvest in gas-powered vehicles
Rental car giant Hertz on Thursday said it will sell about 20,000 electric vehicles from its U.S. fleet and expects to invest in more gas-powered vehicles.

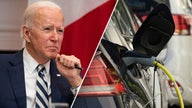
Tesla takes Biden's $7.5B subsidy, agrees to open up charging network, White House says
The White House on Wednesday announced that Tesla has committed to expand its electric vehicle charging network and meet the Department of Transportation's new universal charging standards.
Hertz to face 100 new false arrest claims from customers
To date, at least 230 cases have been filed against Hertz through an expansive lawsuit in Delaware bankruptcy court seeking over $750 million in damages.

Hertz CEO plans to tackle false arrests issue, expects settlement with victims
Hertz claimed that these incidents are "rare and happen only after exhaustive attempts to reach the customer."