About diageo plc - DEO
DEO At a Glance
| Phone | 44-20-7947-9100 | Revenue | 20.34B | |
| Industry | Beverages: Alcoholic | Net Income | 2.36B | |
| Sector | Consumer Non-Durables | 2025 Sales Growth | 0.259% | |
| Fiscal Year-end | 06 / 2026 | Employees | 29,632 | |
| View SEC Filings |
DEO Valuation
| P/E Current | 18.962 |
| P/E Ratio (with extraordinary items) | N/A |
| P/E Ratio (without extraordinary items) | 23.687 |
| Price to Sales Ratio | 2.762 |
| Price to Book Ratio | 5.051 |
| Price to Cash Flow Ratio | 13.01 |
| Enterprise Value to EBITDA | 12.292 |
| Enterprise Value to Sales | 3.93 |
| Total Debt to Enterprise Value | 0.305 |
DEO Efficiency
| Revenue/Employee | 686,373.782 |
| Income Per Employee | 79,808.54 |
| Receivables Turnover | 5.46 |
| Total Asset Turnover | 0.429 |
DEO Liquidity
| Current Ratio | 1.633 |
| Quick Ratio | 0.638 |
| Cash Ratio | 0.254 |
DEO Profitability
| Gross Margin | 60.494 |
| Operating Margin | 28.279 |
| Pretax Margin | 16.518 |
| Net Margin | 11.628 |
| Return on Assets | 4.989 |
| Return on Equity | 22.393 |
| Return on Total Capital | 6.663 |
| Return on Invested Capital | 7.741 |
DEO Capital Structure
| Total Debt to Total Equity | 220.027 |
| Total Debt to Total Capital | 68.753 |
| Total Debt to Total Assets | 49.473 |
| Long-Term Debt to Equity | 192.615 |
| Long-Term Debt to Total Capital | 60.187 |
Diageo Plc in the News

Wine spirit: States seek to end shipment bans as local winery customers navigate uneven policies
Delaware and Mississippi are taking action to allow wine shipments and help local wineries whose customers find they cant take their products home.

Johnnie Walker, Casamigos parent company posts first annual sales decline since 2020
The world's top spirits maker Diageo reported its first annual sales decline in four years amid sliding sales in Latin and North America and cited a "cautious consumer environment."
Irish pub forced to shutter as California crime wave scares patrons away: owner
A pub in Oakland, California, announced it will permanently shutter its doors at the end of October due to rising crime and operating costs, the owner said.

Beverage company Diageo ends business relationship with Sean ‘Diddy’ Combs
Drinks giant Diageo has moved to end its 15-year business relationship with Sean ‘Diddy’ Combs after the rapper sued over allegations of racism in the handling of his liquor brands.

Ryan Reynolds, Jessie James Decker tease her husband Eric Decker over his vasectomy refusal in Aviation Gin ad
Jessie James Decker teased her husband about not getting a vasectomy in a new ad for Ryan Reynolds' liquor company, Aviation American Gin.
Sean ‘Diddy’ Combs accuses spirits giant of racism in lawsuit over alleged neglect of vodka, tequila brands
Rapper and entrepreneur Sean "Diddy" Combs filed a lawsuit in New York Supreme Court Wednesday, accusing Diageo of neglecting his vodka and tequila brands.

Guinness maker Diageo appoints its first female CEO
The London-based maker of Johnnie Walker Scotch whisky, Guinness stout and Smirnoff vodka, said Tuesday that Crew would take over from Mr. Menezes on July 1.
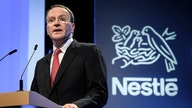
Brace for Higher Prices for Ice Cream, Beer and Bottled Water
The makers of some of the world’s bestselling food and drink brands warned they would keep raising prices as they grapple with the strongest inflation in years.