About airbnb inc. - ABNB
ABNB At a Glance
| Phone | 1-415-728-0108 | Revenue | 12.31B | |
| Industry | Hotels/Resorts/Cruise lines | Net Income | 2.51B | |
| Sector | Consumer Services | 2025 Sales Growth | 10.836% | |
| Fiscal Year-end | 12 / 2026 | Employees | 8,200 | |
| View SEC Filings |
ABNB Valuation
| P/E Current | 34.284 |
| P/E Ratio (with extraordinary items) | N/A |
| P/E Ratio (without extraordinary items) | 33.633 |
| Price to Sales Ratio | 6.871 |
| Price to Book Ratio | 9.965 |
| Price to Cash Flow Ratio | 18.20 |
| Enterprise Value to EBITDA | 28.065 |
| Enterprise Value to Sales | 6.158 |
| Total Debt to Enterprise Value | 0.03 |
ABNB Efficiency
| Revenue/Employee | 1,500,609.756 |
| Income Per Employee | 306,219.512 |
| Receivables Turnover | 66.156 |
| Total Asset Turnover | 0.57 |
ABNB Liquidity
| Current Ratio | 1.377 |
| Quick Ratio | 1.377 |
| Cash Ratio | 0.81 |
ABNB Profitability
| Gross Margin | 72.263 |
| Operating Margin | 21.203 |
| Pretax Margin | 25.494 |
| Net Margin | 20.406 |
| Return on Assets | 11.634 |
| Return on Equity | 30.233 |
| Return on Total Capital | 23.983 |
| Return on Invested Capital | 26.368 |
ABNB Capital Structure
| Total Debt to Total Equity | 27.698 |
| Total Debt to Total Capital | 21.691 |
| Total Debt to Total Assets | 10.226 |
| Long-Term Debt to Equity | 2.488 |
| Long-Term Debt to Total Capital | 1.948 |
Airbnb Inc. in the News

Los Angeles wildfires: Big businesses make donations, offer services to those impacted by infernos
Several companies are offering services and donations to victims of the Los Angeles wildfires that have killed at least 11 and destroyed thousands of homes and businesses.

Airbnb offers Southern California wildfire victims temporary housing
Airbnb said Wednesday that it is teaming up with 211 LA on a free temporary housing initiative in response to the ongoing wildfires in the Los Angeles area.

Life-sized Polly Pocket Airbnb in Massachusetts to open for booking
Airbnb is offering a nostalgic experience announcing a Polly Pocket-themed stay in Littleton, Massachusetts, which looks like the actual toy from the 1990s.

Tourist hot spot to ban vacation apartments in bid to make city 'livable' again
Florence and New York City are just a couple of the cities that have looked to stop new short-term rentals as housing prices hit record levels, making it difficult for locals.

California man shares 'horror story' of Airbnb booking experience on social media
An Airbnb customer shared his "brutal' experience booking a stay in London. He told FOX Business he believes he was scammed by the host and Airbnb eventually resolved the issue.

Airbnb renters-turned-squatters refuse to vacate property unless evicted: court docs
An Airbnb host in Durham, North Carolina, allowed guests to enter a multi-month rental agreement, and now they are refusing to leave unless evicted, according to court documents.

Christina Aguilera puts Las Vegas home on Airbnb with meet & greet, burlesque lesson, boudoir photoshoot
Christina Aguilera is giving four fans the opportunity to spend the weekend in a luxury Las Vegas home, along with VIP tickets to her concert and an evening with her.

Expedia shares sink after 2024 revenue warning on softening air fares
Expedia shares closed down 18% on Friday, their biggest single-day drop in nearly four years, after the online travel firm said it expected 2024 revenue growth rates to moderate.

Airbnb acquires GamePlanner.AI startup led by Siri co-founder
Airbnb says it has purchased the startup GamePlanner.AI to help collaborate on creating “some of the best interfaces and practical applications for AI."
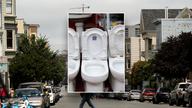
Airbnb guests let clogged toilet run 15 hours, then leave pregnant owner on the hook
A pregnant California woman is homeless and hundreds of thousands of dollars in debt after Airbnb guests reportedly flooded her house by clogging a toilet.