carmax inc. - KMX

KMX

Close Chg Chg %
39.89 0.46 1.14%

Closed Market

40.35

+0.46 (1.14%)

Volume: 2.32M

Last Updated:

May 8, 2026, 3:59 PM EDT

Company Overview: carmax inc. - KMX

KMX Key Data

Open

$39.97

Day Range

39.52 - 40.43

52 Week Range

30.26 - 71.99

Market Cap

$5.66B

Shares Outstanding

141.82M

Public Float

135.94M

Beta

1.18

Rev. Per Employee

N/A

P/E Ratio

23.82

EPS

$1.60

Yield

0.00%

Dividend

N/A

EX-DIVIDEND DATE

SHORT INTEREST

N/A

AVERAGE VOLUME

3.59M


KMX Performance

1 Week
 
4.70%
 
1 Month
 
-13.66%
 
3 Months
 
-2.63%
 
1 Year
 
-38.97%
 
5 Years
 
-67.68%
 

KMX Analyst Ratings

  • Sell
  • Under
  • Hold
  • Over
  • Buy
Number of Ratings 20
Full Ratings ➔

About carmax inc. - KMX

CarMax, Inc. is a holding company, which engages in the retail of used vehicles and wholesale of vehicle auction operators. It operates through the CarMax Sales Operations and CarMax Auto Finance (CAF) segments. The CarMax Sales Operations segment consists of all aspects of its auto merchandising and service operations. The CAF segment pertains to its finance operation, which offers vehicle financing services to customers buying retail vehicles. The company was founded by Richard L. Sharp and William Austin Ligon in 1993 and is headquartered in Richmond, VA.

KMX At a Glance

CarMax, Inc.
12800 Tuckahoe Creek Parkway
Richmond, Virginia 23238
Phone 1-804-747-0422 Revenue 27.75B
Industry Specialty Stores Net Income 247.29M
Sector Retail Trade Employees 27,796
Fiscal Year-end 02 / 2027
View SEC Filings

KMX Valuation

P/E Current 23.823
P/E Ratio (with extraordinary items) N/A
P/E Ratio (without extraordinary items) 25.769
Price to Sales Ratio 0.23
Price to Book Ratio 1.04
Price to Cash Flow Ratio 3.57
Enterprise Value to EBITDA 25.177
Enterprise Value to Sales 0.879
Total Debt to Enterprise Value 0.768

KMX Efficiency

Revenue/Employee 998,177.867
Income Per Employee 8,896.604
Receivables Turnover 90.985
Total Asset Turnover 1.02

KMX Liquidity

Current Ratio 2.199
Quick Ratio 0.486
Cash Ratio 0.296

KMX Profitability

Gross Margin 11.024
Operating Margin 2.182
Pretax Margin 1.382
Net Margin 0.891
Return on Assets 0.909
Return on Equity 4.077
Return on Total Capital 1.004
Return on Invested Capital 1.013

KMX Capital Structure

Total Debt to Total Equity 318.175
Total Debt to Total Capital 76.087
Total Debt to Total Assets 70.19
Long-Term Debt to Equity 303.977
Long-Term Debt to Total Capital 72.691
  • Income Statement
  • Balance Sheet
  • Cash Flow Statement

Annual Financials for Carmax Inc. - KMX

Collapse All in section
All values USD millions. 2023 2024 2025 2026 5-year trend
Sales/Revenue
31.13B 28.21B 28.21B 27.75B
Sales Growth
-6.24% -9.36% -0.02% -1.64%
Cost of Goods Sold (COGS) incl D&A
27.89B 25.17B 24.98B 24.69B
COGS excluding D&A
- - - -
-
Depreciation & Amortization Expense
280.72M 293.30M 311.90M 363.56M
Depreciation
259.90M 277.90M 304.90M 335.90M
Amortization of Intangibles
20.82M 15.40M 7.00M 27.66M
COGS Growth
-4.87% -9.75% -0.75% -1.19%
Gross Income
3.24B 3.04B 3.22B 3.06B
Gross Income Growth
-16.56% -5.96% +5.98% -5.13%
Gross Profit Margin
+10.39% +10.78% +11.43% +11.02%
2023 2024 2025 2026 5-year trend
SG&A Expense
2.49B 2.29B 2.44B 2.45B
Research & Development
- - - -
-
Other SG&A
2.49B 2.29B 2.44B 2.45B
SGA Growth
+6.97% -8.08% +6.52% +0.74%
Other Operating Expense
- - - -
-
Unusual Expense
- - - 141.26M
-
EBIT after Unusual Expense
747.80M 756.07M 788.92M 464.09M
Non Operating Income/Expense
9.40M 10.27M (11.62M) 29.73M
Non-Operating Interest Income
- - - -
-
Equity in Earnings of Affiliates
- - - -
-
Interest Expense
120.40M 124.75M 107.94M 110.39M
Interest Expense Growth
+27.95% +3.61% -13.47% +2.27%
Gross Interest Expense
126.00M 130.95M 116.14M 125.19M
Interest Capitalized
5.60M 6.20M 8.20M 14.80M
Pretax Income
636.80M 641.60M 669.36M 383.43M
Pretax Income Growth
-57.33% +0.75% +4.33% -42.72%
Pretax Margin
+2.05% +2.27% +2.37% +1.38%
Income Tax
152.04M 162.39M 168.80M 136.14M
Income Tax - Current - Domestic
158.59M 167.19M 192.53M 62.34M
Income Tax - Current - Foreign
- - - -
-
Income Tax - Deferred - Domestic
(6.55M) (4.80M) (23.72M) 73.80M
Income Tax - Deferred - Foreign
- - - -
-
Income Tax Credits
- - - -
-
Equity in Earnings of Affiliates
- - - -
-
Other After Tax Income (Expense)
- - - -
-
Consolidated Net Income
484.76M 479.20M 500.56M 247.29M
Minority Interest Expense
- - - -
-
Net Income
484.76M 479.20M 500.56M 247.29M
Net Income Growth
-57.89% -1.15% +4.46% -50.60%
Net Margin Growth
+1.56% +1.70% +1.77% +0.89%
Extraordinaries & Discontinued Operations
- - - -
-
Discontinued Operations
- - - -
-
Net Income After Extraordinaries
484.76M 479.20M 500.56M 247.29M
Preferred Dividends
- - - -
-
Net Income Available to Common
484.76M 479.20M 500.56M 247.29M
EPS (Basic)
3.0527 3.0288 3.2225 1.6793
EPS (Basic) Growth
-56.94% -0.78% +6.40% -47.89%
Basic Shares Outstanding
158.80M 158.22M 155.33M 147.26M
EPS (Diluted)
3.0341 3.0194 3.2074 1.6753
EPS (Diluted) Growth
-56.47% -0.48% +6.23% -47.77%
Diluted Shares Outstanding
159.77M 158.71M 156.06M 147.61M
EBITDA
1.03B 1.05B 1.10B 968.91M
EBITDA Growth
-43.85% +2.03% +4.90% -11.98%
EBITDA Margin
+3.30% +3.72% +3.90% +3.49%

Snapshot

Average Recommendation HOLD Average Target Price 37.00
Number of Ratings 20 Current Quarters Estimate 0.954
FY Report Date 05 / 2026 Current Year's Estimate 2.342
Last Quarter’s Earnings 0.34 Median PE on CY Estimate N/A
Year Ago Earnings 2.91 Next Fiscal Year Estimate 2.826
Median PE on Next FY Estimate N/A

Earnings Per Share

This Quarter Next Quarter This Fiscal Next Fiscal
# of Estimates 11 10 15 14
Mean Estimate 0.95 0.64 2.34 2.83
High Estimates 1.10 0.74 2.80 3.35
Low Estimate 0.76 0.52 1.93 1.88
Coefficient of Variance 11.54 13.81 10.15 15.60

Analysts Recommendations

Current 1 Month Ago 3 Months Ago
BUY 1 1 1
OVERWEIGHT 2 2 2
HOLD 12 12 15
UNDERWEIGHT 2 2 1
SELL 3 3 3
MEAN Hold Hold Hold

Insider Actions for Carmax Inc. - KMX

Date Name Shares Transaction Value
Jul 10, 2025 John Mac Stuckey SVP, Gen Counsel & Secretary 1,667 Bona fide gift 0.00

Carmax Inc. in the News

Used cars now less affordable for buyers

Consumers have been facing affordability issues with used cars, something that used car dealer CarMax noted in its latest quarter earnings this week.

Used car prices jump 40%: CarMax

CarMax experienced a slowdown in fourth-quarter used car sales volume as its average retail selling price jumped 39.7% annually.

Selling a car? What to consider beyond the price tag

When Erin Adams decided to leave the Portland, Ore., area and consider cheaper locations, she prepared to sell her secondhand 2005 Toyota Scion xB for something a bit more capable of hauling her belongings.

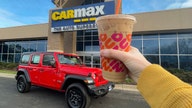
CarMax offering 24-hour test drives with free Dunkin'

CarMax has teamed up with Dunkin' to offer $10 gift cards to customers who take one of its cars for a 24-hour test drive. The used car retailer is also allowing purchased cars to be returned for a full refund within 30 days.