About alibaba group holding ltd. - BABA
BABA At a Glance
| Phone | 86-571-8502-2088 | Revenue | 144.12B | |
| Industry | Internet Retail | Net Income | 14.91B | |
| Sector | Retail Trade | 2026 Sales Growth | 4.411% | |
| Fiscal Year-end | 03 / 2027 | Employees | 131,462 | |
| View SEC Filings |
BABA Valuation
| P/E Current | 16.341 |
| P/E Ratio (with extraordinary items) | N/A |
| P/E Ratio (without extraordinary items) | 19.53 |
| Price to Sales Ratio | 2.093 |
| Price to Book Ratio | 1.897 |
| Price to Cash Flow Ratio | 28.11 |
| Enterprise Value to EBITDA | 20.376 |
| Enterprise Value to Sales | 2.081 |
| Total Debt to Enterprise Value | 0.136 |
BABA Efficiency
| Revenue/Employee | 1,096,277.109 |
| Income Per Employee | 113,415.584 |
| Receivables Turnover | 5.388 |
| Total Asset Turnover | 0.549 |
BABA Liquidity
| Current Ratio | 1.271 |
| Quick Ratio | 1.231 |
| Cash Ratio | 0.753 |
BABA Profitability
| Gross Margin | 39.484 |
| Operating Margin | 5.817 |
| Pretax Margin | 12.64 |
| Net Margin | 10.346 |
| Return on Assets | 5.678 |
| Return on Equity | 10.183 |
| Return on Total Capital | 7.672 |
| Return on Invested Capital | 8.296 |
BABA Capital Structure
| Total Debt to Total Equity | 26.555 |
| Total Debt to Total Capital | 20.983 |
| Total Debt to Total Assets | 14.753 |
| Long-Term Debt to Equity | 23.488 |
| Long-Term Debt to Total Capital | 18.559 |
Alibaba Group Holding Ltd. in the News

Alibaba touts new AI model it says rivals DeepSeek, OpenAI, Meta's top offerings
Alibaba says the latest version of its Qwen 2.5 artificial intelligence model can take on fellow Chinese firm DeepSeek's V3 as well as the top models from U.S. rivals OpenAI and Meta.
Alibaba to split into 6 units, explore separate IPOs
News of the restructuring comes one day after Alibaba founder Jack Ma was spotted at a primary school in Hangzhou, marking his first public appearance in mainland China in over a year.
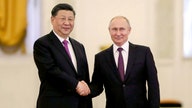
Chinese stocks plunge on COVID-19 fears, concerns over Beijing and Moscow's relationship
Chinese stocks took a dive on Monday as the country combats its worst COVID-19 outbreak in two years and concerns grow over Beijing's close relationship with Moscow.

Meta/Facebook voted worst company of 2021: survey
Facebook, which was recently rebranded as “Meta,” was rated the worst company of the year, according to a recent survey.

Billionaire Alibaba founder Jack Ma reappears in Hong Kong: sources
Alibaba Group founder Jack Ma, largely out of public view since a regulatory clampdown started on his business empire late last year, is currently in Hong Kong and has met business associates in recent days.
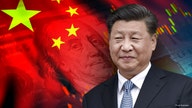
Xi Jinping aims to rein in Chinese capitalism, hew to Mao’s socialist vision
Xi Jinping’s campaign against private enterprise, it is increasingly clear, is far more ambitious than meets the eye. China's Communist president aims to rein in Chinese capitalism and hew to Mao Zedong's socialist vision.

Chinese apps could face subpoenas or bans under Biden order
President Joe Biden's executive order aimed at safeguarding Americans' sensitive data would force some Chinese apps to take tougher measures to protect private information if they want to remain in the U.S. market, according to people familiar with the matter.

China launches hotline for netizens to report 'illegal' history comments
China is looking to stamp out 'historical nihilism,' which is doubt over government descriptions of events.