Where’s the Noise? Unraveling Wall Street’s Low-Volume Mystery

Peaking under the hood of the 25% stock-market rally since late October has left some market participants scratching their heads.
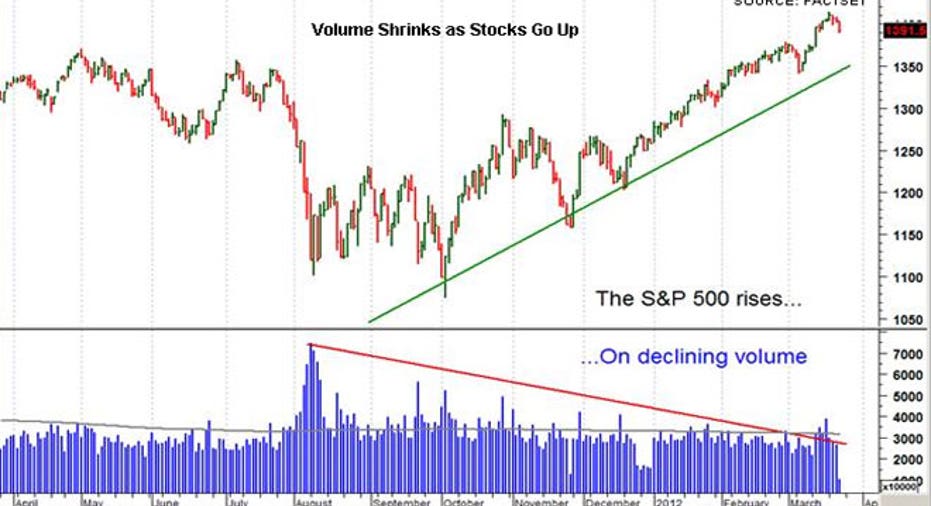
While the gains seem to have been built on some credible factors, namely the easing eurozone debt crisis and a strengthening U.S. economy, trading volumes have uncharacteristically shrank during the rally.
Given that conventional wisdom holds that “volume confirms price,” this anomaly could easily be construed as a bearish signal, especially given this week’s mini pullback.
“If this is such a good party, why isn’t anyone here?” Nicholas Colas, chief market strategist at ConvergEx, writes in a research note.
But before you push the sell button, realize there are a number of potential innocent explanations for the low-volume, high stock price trend, including a drop-off in market participants and a plunge in market volatility.
Volume Slips Even as Stock Prices Rise
According to data compiled by FOX Business, the average New York Stock Exchange composite trading volume since October 3 totaled 4.04 billion, down 8.9% from the same period the year before and off 6.9% from the prior five-month span.
As volumes have slipped, the markets have soared, with the S&P 500 up as much as 25% from its October lows of 1099.
“Volume is a distorted indicator these days,” said Joe Saluzzi, co-head of trading at Themis Trading. “Everything has been so turned upside. There are a lot of [technical indicators] that don’t work that used to work.”
Investors may be wondering about how “real” the rally has been given that the markets are mired in a rare pullback. As of late Thursday, the Dow was off close to 200 points on the week.
Pado predicted the markets could end up with a 5% drop, but not a more serious 10% one that would indicate a correction. “It makes a lot of sense both technically and seasonally that you would see that kind of a pullback. It wouldn’t be anything but healthy to see that kind of a pullback,” said Marc Pado, U.S. market strategist at investment advisory DowBull.
Fewer Investors, Lower Volume
One likely culprit for the decline in trading volume is the shrinking number of market participants, especially on the retail side.
“If this is such a good party, why isn’t anyone here?”
Retail investors have been “beaten up,” said Pado, pointing to the painful losses inflicted by the bursting of the dotcom bubble and 2008 Wall Street crisis. “You had a one-two punch on a whole generation that was completely crushed.”
According to the Investment Company Institute, long-term U.S. equity mutual funds have experienced outflows of cash every month since the markets began their autumn ascent. ICI estimates that a total of about $43.2 billion has been drained from these funds since the end of October.
“How could a market that is losing all of this money go up 30%? That’s the question that has left people shaking their heads,” said Saluzzi.
Volatility Vanishes
Colas also points to the Volcker Rule, which has led to the “dismantling” of internal hedge funds inside brokerage firms like Morgan Stanley (NYSE:MS). Many of these funds have been downsized and left with less capital to play with.
In addition to fewer market players, the weaker trading volumes reflect the relative calm that has come over Wall Street in recent months.
As fears about a banking crisis or double-dip recession have faded, so has the volatility that traders and especially high-frequency traders feed on. Earlier this month the VIX, which keeps a pulse on investor fear, plummeted to as low as 13.66, representing a 71.5% plunge since surging to scary levels of 48 in August.
“When asset prices move less dramatically, there is less of a need to move capital around in the hopes of finding return or at least avoiding loss,” Colas said.
This is especially true given the structural changes to U.S. stock trading that has taken shape over the past decade. The new structure puts high-frequency traders near the center, "acting as hybrid hedge fund/liquidity provider/arbitrage agent between all the different venues where you can trade stock."
Rethinking Volume Theories
So do these factors mean investors shouldn’t throw the old “volume confirms price” theory out the window?
Pado said rather than focusing on overall volume, investors should pay more attention to how each day’s volume stacks up against a given average, such as a 50-day moving average. This way the daily figures can be looked at with a comparable figure.
To prove that the old volume maxim can still play a role, Colas analyzed single-stock volume trends in the 20 best and worst-performing S&P 500 stock so far this year. He found that the average daily volumes for the best stocks since December 2011 is up 25%, compared with a 15% gain for the worst performers.
Likewise, average daily volume for the best performers is up 0.4% in March, besting an 11.6% drop for the worst stocks. Colas also notes that the top stocks showing increasing volume live in cyclical sectors such as the financials, technology and consumer discretionary.
For example, shares of Apple (NASDAQ:AAPL) have soared 48.4% so far this year, while the average daily volume in the stock is up a whopping 121%. Similarly, Bank of America’s (NYSE:BAC) shares have skyrocketed 71.7% in 2012 and its average daily volume is up 8.1% this year and 38.5% since December.
“Overall market volumes are down but… ‘volume confirms price’ is not entirely dead,” said Colas.
(Adam Samson contributed to this story.)


