About watts water technologies inc. - WTS
WTS At a Glance
| Phone | 1-978-688-1811 | Revenue | 2.44B | |
| Industry | Industrial Machinery | Net Income | 340.80M | |
| Sector | Producer Manufacturing | 2025 Sales Growth | 8.272% | |
| Fiscal Year-end | 12 / 2026 | Employees | 5,700 | |
| View SEC Filings |
WTS Valuation
| P/E Current | 27.146 |
| P/E Ratio (with extraordinary items) | N/A |
| P/E Ratio (without extraordinary items) | 27.132 |
| Price to Sales Ratio | 3.792 |
| Price to Book Ratio | 4.539 |
| Price to Cash Flow Ratio | 23.00 |
| Enterprise Value to EBITDA | 17.226 |
| Enterprise Value to Sales | 3.745 |
| Total Debt to Enterprise Value | 0.032 |
WTS Efficiency
| Revenue/Employee | 427,807.018 |
| Income Per Employee | 59,789.474 |
| Receivables Turnover | 8.177 |
| Total Asset Turnover | 0.924 |
WTS Liquidity
| Current Ratio | 2.51 |
| Quick Ratio | 1.487 |
| Cash Ratio | 0.791 |
WTS Profitability
| Gross Margin | 49.391 |
| Operating Margin | 19.348 |
| Pretax Margin | 18.282 |
| Net Margin | 13.976 |
| Return on Assets | 12.913 |
| Return on Equity | 18.246 |
| Return on Total Capital | 14.692 |
| Return on Invested Capital | 16.035 |
WTS Capital Structure
| Total Debt to Total Equity | 14.396 |
| Total Debt to Total Capital | 12.584 |
| Total Debt to Total Assets | 10.131 |
| Long-Term Debt to Equity | 13.72 |
| Long-Term Debt to Total Capital | 11.993 |
Watts Water Technologies Inc. in the News

Stablecoin bill, originally bipartisan, hits snag as Dems splinter
Sen. Bill Hagerty is spearheading legislation to regulate stablecoin, a cryptocurrency linked to fiat currencies like the dollar, but he has hit a snag.

Trump drops $500 tip at Philly cheesesteak restaurant as possible VP name is floated in crowd interaction
Former President Trump made an unexpected campaign stop at a small business, Tony and Nick's Steaks, in Philadelphia before a rally Saturday, and left a $500 tip.

Biden's attempt to mimic Trump's namecalling backfires after 'Broke Don's' stock soars
President Biden attempted to co-opt former President Trump's penchant for nicknames to little success after his "Broke Don" moniker was beset by the GOP nominee's social media company's stock soaring.
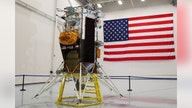
US hours away from attempt at first moon landing in half century with private robot spacecraft
Those interested in watching the first U.S. spacecraft to land on the moon in more than half a century may be able to do so on Thursday.

LARRY KUDLOW: This would be a death sentence for the entire economy
FOX Business host Larry Kudlow gives his take on the state of the economy under President Joe Biden on Friday's "Kudlow."

Ever Forward container ship stuck in muddy bottom of Chesapeake Bay for over a month finally freed
A container ship that was stuck in the Chesapeake Bay for over a month has finally been refloated, officials said.

Former NYSE CEO says boom in SPAC companies has been 'a disaster'
The former chief executive of the New York Stock Exchange discussed the state of the market when it comes to the recent reported increase in SPAC (Special Purpose Aquisition) Companies.

Harley-Davidson spinning off LiveWire electric motorcycle brand in SPAC merger
Harley-Davidson will spin off its LiveWire electric motorcycle brand into a new public company by combining it with AEA-Bridges Impact Corp.