About tomy - TOMYY
Tomy Co., Ltd. engages in the planning, manufacture and sale of toys, general merchandise, card games and baby care products. The company also provides the sale of video games, mini-capsule toys, confectioneries, apparels, miscellaneous daily goods, books, amusement machines and others. Its brands include Tomica, Plarail, Licca-chan and Koeda-chan. The company was founded by Eichiro Tomiyama on February 2, 1924 and is headquartered in Tokyo, Japan.
TOMYY At a Glance
Tomy Co., Ltd.
7-9-10 Tateishi
Tokyo, Tokyo 124-8511
| Phone | 81-3-5654-1548 | Revenue | 1.64B | |
| Industry | Recreational Products | Net Income | 107.25M | |
| Sector | Consumer Durables | 2025 Sales Growth | 13.785% | |
| Fiscal Year-end | 03 / 2026 | Employees | 2,496 | |
| View SEC Filings |
TOMYY Valuation
| P/E Current | 14.35 |
| P/E Ratio (with extraordinary items) | N/A |
| P/E Ratio (without extraordinary items) | 19.393 |
| Price to Sales Ratio | 1.268 |
| Price to Book Ratio | 2.92 |
| Price to Cash Flow Ratio | 18.66 |
| Enterprise Value to EBITDA | 8.164 |
| Enterprise Value to Sales | 1.083 |
| Total Debt to Enterprise Value | 0.041 |
TOMYY Efficiency
| Revenue/Employee | 657,619.979 |
| Income Per Employee | 42,967.957 |
| Receivables Turnover | 8.377 |
| Total Asset Turnover | 1.487 |
TOMYY Liquidity
| Current Ratio | 2.246 |
| Quick Ratio | 1.814 |
| Cash Ratio | 1.103 |
TOMYY Profitability
| Gross Margin | 40.502 |
| Operating Margin | 9.939 |
| Pretax Margin | 9.513 |
| Net Margin | 6.534 |
| Return on Assets | 9.719 |
| Return on Equity | 15.631 |
| Return on Total Capital | 13.684 |
| Return on Invested Capital | 14.824 |
TOMYY Capital Structure
| Total Debt to Total Equity | 10.152 |
| Total Debt to Total Capital | 9.217 |
| Total Debt to Total Assets | 6.516 |
| Long-Term Debt to Equity | 3.594 |
| Long-Term Debt to Total Capital | 3.263 |
Tomy in the News
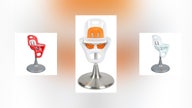
Over 85,000 TOMY highchairs recalled over possible loose bolts that pose a fall risk for children
TOMY, a manufacturer of children’s products, has initiated a recall of 85,000 high chairs after a consumer report deemed them unsafe.