About keurig dr pepper inc. - KDP
Keurig Dr Pepper, Inc. engages in the manufacture, marketing, distribution, and sales of non-alcoholic beverages. It operates through the following segments: U.S. Refreshment Beverages, U.S. Coffee, and International. The U.S. Refreshment Beverages segment manufactures and distributes beverage concentrates, syrups, and finished beverages including the brands Dr Pepper, Canada Dry, Mott’s, Snapple, A&W, 7UP, Sunkist soda, Squirt, Hawaiian Punch, Core Hydration, Bai, C4 Energy, Clamato, Evian, Yoo-Hoo, Big Red, and Vita Coco. The U.S. Coffee segment involves single serve brewers, specialty, hot and iced varieties, and ready-to-drink beverages. The International segment includes sales in Canada, Mexico, and other markets. The company was founded in 2018 and is headquartered in Frisco, TX.
KDP At a Glance
Keurig Dr Pepper, Inc.
6425 Hall of Fame Lane
Frisco, Texas 75034
| Phone | 1-800-527-7096 | Revenue | 16.60B | |
| Industry | Beverages: Non-Alcoholic | Net Income | 2.08B | |
| Sector | Consumer Non-Durables | 2025 Sales Growth | 8.156% | |
| Fiscal Year-end | 12 / 2026 | Employees | 30,600 | |
| View SEC Filings |
KDP Valuation
| P/E Current | 23.361 |
| P/E Ratio (with extraordinary items) | N/A |
| P/E Ratio (without extraordinary items) | 18.361 |
| Price to Sales Ratio | 2.299 |
| Price to Book Ratio | 1.491 |
| Price to Cash Flow Ratio | 20.56 |
| Enterprise Value to EBITDA | 12.736 |
| Enterprise Value to Sales | 3.319 |
| Total Debt to Enterprise Value | 0.326 |
KDP Efficiency
| Revenue/Employee | 542,581.699 |
| Income Per Employee | 67,941.176 |
| Receivables Turnover | 9.936 |
| Total Asset Turnover | 0.305 |
KDP Liquidity
| Current Ratio | 0.635 |
| Quick Ratio | 0.426 |
| Cash Ratio | 0.126 |
KDP Profitability
| Gross Margin | 50.316 |
| Operating Margin | 21.526 |
| Pretax Margin | 16.184 |
| Net Margin | 12.522 |
| Return on Assets | 3.819 |
| Return on Equity | 8.356 |
| Return on Total Capital | 4.78 |
| Return on Invested Capital | 5.284 |
KDP Capital Structure
| Total Debt to Total Equity | 70.47 |
| Total Debt to Total Capital | 41.338 |
| Total Debt to Total Assets | 32.422 |
| Long-Term Debt to Equity | 57.003 |
| Long-Term Debt to Total Capital | 33.439 |
Keurig Dr Pepper Inc. in the News

Popular soda flavor returns as Keurig Dr Pepper rolls out 35 new drinks
Keurig Dr Pepper unveils over 35 new drinks including Dr Pepper Creamy Coconut, A&W Root Beer Float and 7UP Shirley Temple as beverage giant expands lineup.

Keurig Dr Pepper to buy Peet's coffee owner in $18B deal
Keurig Dr Pepper will acquire Dutch firm JDE Peet's in an $18 billion deal and plans to split up its beverage and coffee units into two independent companies.
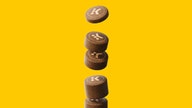
Keurig introduces new pod design that lacks one significant trait
Keurig Dr. Pepper has a single-serve Keurig coffee pod that doesn’t have any plastic in the pipeline. It is called the 'K-Round' and also doesn't have aluminum.
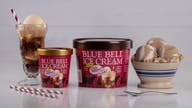
Dr. Pepper and Blue Bell team up to create brand-new ice cream flavor
Dr Pepper and Blue Bell have introduced a new ice cream flavor called Dr Pepper Float, which combines vanilla ice cream with a Dr Pepper-flavored sherbet, Blue Bell announced.