About jollibee foods - JBFCF
Jollibee Foods Corp. engages in the development, operation, and franchising fast food stores under the trade name Jollibee. It operates through the following segments: Food Service, Franchising, and Support Services. The Food Service segment operates quick service restaurants and the manufacture of food products to be sold to Jollibee Group-owned and franchised QSR outlets. The Franchising segment franchises the Jollibee Group's QSR store concepts. The Support Services segment focuses on the various services mainly to the Jollibee Group’s independent franchisees like but not limited to repairs and maintenance of store equipment, staffing, helpdesk services and other business activities in support of the QSR systems. The company was founded by Tony Tan Caktiong in 1975 and is headquartered in Pasig City, Philippines.
JBFCF At a Glance
Jollibee Foods Corp.
10th Floor, Jollibee Plaza Building
Pasig City, Metropolitan Manila 1605
| Phone | 63-2-634-1111 | Revenue | 5.31B | |
| Industry | Restaurants | Net Income | 189.04M | |
| Sector | Consumer Services | 2025 Sales Growth | 12.602% | |
| Fiscal Year-end | 12 / 2026 | Employees | 12,600 | |
| View SEC Filings |
JBFCF Valuation
| P/E Current | 14.218 |
| P/E Ratio (with extraordinary items) | N/A |
| P/E Ratio (without extraordinary items) | 18.747 |
| Price to Sales Ratio | 0.648 |
| Price to Book Ratio | 3.039 |
| Price to Cash Flow Ratio | 6.08 |
| Enterprise Value to EBITDA | 7.919 |
| Enterprise Value to Sales | 1.023 |
| Total Debt to Enterprise Value | 0.436 |
JBFCF Efficiency
| Revenue/Employee | 421,073.004 |
| Income Per Employee | 15,003.522 |
| Receivables Turnover | 28.567 |
| Total Asset Turnover | 1.133 |
JBFCF Liquidity
| Current Ratio | 0.92 |
| Quick Ratio | 0.687 |
| Cash Ratio | 0.435 |
JBFCF Profitability
| Gross Margin | 18.276 |
| Operating Margin | 6.762 |
| Pretax Margin | 5.221 |
| Net Margin | 3.563 |
| Return on Assets | 4.037 |
| Return on Equity | 14.57 |
| Return on Total Capital | 5.109 |
| Return on Invested Capital | 5.879 |
JBFCF Capital Structure
| Total Debt to Total Equity | 177.743 |
| Total Debt to Total Capital | 63.995 |
| Total Debt to Total Assets | 49.233 |
| Long-Term Debt to Equity | 169.824 |
| Long-Term Debt to Total Capital | 51.784 |
Jollibee Foods in the News
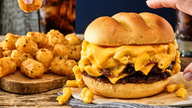
Smashburger launches mac and cheese burger nationwide: 'Taste innovation'
Smashburger has launched a new S'mac & Cheese Burger nationwide. The sandwich combines beef with macaroni and cheese. Customers can also add mac and cheese to other orders.
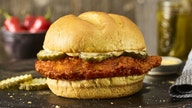
Smashburger joins chicken sandwich wars with limited time spicy offering
Smashburger announced Monday that it has released the Scorchin’ Hot Crispy Chicken Sandwich at locations nationwide until June 15.