About fox corp. - FOX
FOX At a Glance
| Phone | 1-212-852-7000 | Revenue | 17.13B | |
| Industry | Broadcasting | Net Income | 1.69B | |
| Sector | Consumer Services | 2026 Sales Growth | 5.067% | |
| Fiscal Year-end | 06 / 2027 | Employees | 10,550 | |
| View SEC Filings |
FOX Valuation
| P/E Current | 15.085 |
| P/E Ratio (with extraordinary items) | N/A |
| P/E Ratio (without extraordinary items) | 12.203 |
| Price to Sales Ratio | 1.201 |
| Price to Book Ratio | 1.69 |
| Price to Cash Flow Ratio | 10.44 |
| Enterprise Value to EBITDA | 6.173 |
| Enterprise Value to Sales | 1.408 |
| Total Debt to Enterprise Value | 0.314 |
FOX Efficiency
| Revenue/Employee | 1,623,317.536 |
| Income Per Employee | 159,715.64 |
| Receivables Turnover | 4.957 |
| Total Asset Turnover | 0.75 |
FOX Liquidity
| Current Ratio | 3.169 |
| Quick Ratio | 2.987 |
| Cash Ratio | 1.577 |
FOX Profitability
| Gross Margin | 34.234 |
| Operating Margin | 20.413 |
| Pretax Margin | 13.301 |
| Net Margin | 9.839 |
| Return on Assets | 7.378 |
| Return on Equity | 14.286 |
| Return on Total Capital | 8.778 |
| Return on Invested Capital | 8.745 |
FOX Capital Structure
| Total Debt to Total Equity | 65.084 |
| Total Debt to Total Capital | 39.425 |
| Total Debt to Total Assets | 33.662 |
| Long-Term Debt to Equity | 64.697 |
| Long-Term Debt to Total Capital | 39.19 |
Fox Corp. in the News
Fox Corporation announces $22B acquisition of Roku in landmark streaming and live TV deal
Lachlan Murdoch calls the $22 billion Roku acquisition a defining moment for FOX, pairing live sports and news with America's top streaming platform.
Fox Corporation reports strong quarter, boosted by advertising and cable growth
Fox Corporation beats earnings estimates with $5.18 billion revenue, up 2% year over year as cable programming and advertising drove strong quarterly growth.
Fox Corp hits advertising revenue record in first quarter
Fox Corp reported record Q1 advertising revenue of $1.4B, up 6% year-over-year, driving total quarterly revenues to $3.74B despite absence of election year political ads.

Fox-owned Credible promotes Robert Humann to CEO role
Credible promotes Chief Revenue Officer Robert Humann to CEO after nearly 10 years with the Fox Corporation-owned consumer finance technology platform.
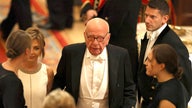
Rupert Murdoch joins US business leaders at Trump's UK state dinner in Windsor Castle
President Trump's historic second state visit to the UK featured a Windsor Castle dinner attended by Rupert Murdoch and major technology and finance executives.

Mamdani’s public grocery stores may have devastating effects on city's food supply
Mayoral candidate Zohran Mamdani's plan for city-owned grocery stores faces criticism from economists and business leaders.

Traditional TV crumbles as streaming finally claims the viewing throne
Nielsen reports streaming has surpassed cable and broadcast combined with 44.8% of TV viewership, while Netflix leads paid services and YouTube sees 120% growth since 2021.

OpenAI, News Corp. sign multi-year content deal
News Corp. and ChatGPT creator OpenAI on Wednesday announced a multi-year deal allowing the artificial intelligence startup to utilize content to support high journalism standards.
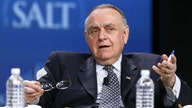
Billionaire investor rails against 's--- for brains' students who think 'river to the sea' means Hudson
Omega Family Office chairman Leon Cooperman joined 'The Claman Countdown' to criticize global antisemitism, saying protesters often don't understand their own words.
Fox's revenue rises amid increased advertising sales
Fox Corp., parent of Fox News and the Fox broadcast network, reported higher revenue in the latest quarter, as more original entertainment programming, live sports and growth at its streaming platforms boosted advertising sales.