About deutsche lufthansa ag - DLAKY
DLAKY At a Glance
| Phone | N/A | Revenue | 44.69B | |
| Industry | Airlines | Net Income | 1.51B | |
| Sector | Transportation | 2025 Sales Growth | 9.932% | |
| Fiscal Year-end | 12 / 2026 | Employees | 103,255 | |
| View SEC Filings |
DLAKY Valuation
| P/E Current | 7.023 |
| P/E Ratio (with extraordinary items) | N/A |
| P/E Ratio (without extraordinary items) | 7.829 |
| Price to Sales Ratio | 0.265 |
| Price to Book Ratio | 0.865 |
| Price to Cash Flow Ratio | 2.80 |
| Enterprise Value to EBITDA | 5.381 |
| Enterprise Value to Sales | 0.435 |
| Total Debt to Enterprise Value | 0.88 |
DLAKY Efficiency
| Revenue/Employee | 432,795.517 |
| Income Per Employee | 14,635.28 |
| Receivables Turnover | 7.103 |
| Total Asset Turnover | 0.828 |
DLAKY Liquidity
| Current Ratio | 0.81 |
| Quick Ratio | 0.728 |
| Cash Ratio | 0.409 |
DLAKY Profitability
| Gross Margin | 9.534 |
| Operating Margin | 2.096 |
| Pretax Margin | 4.447 |
| Net Margin | 3.382 |
| Return on Assets | 2.786 |
| Return on Equity | 11.729 |
| Return on Total Capital | 4.885 |
| Return on Invested Capital | 5.819 |
DLAKY Capital Structure
| Total Debt to Total Equity | 124.938 |
| Total Debt to Total Capital | 55.543 |
| Total Debt to Total Assets | 29.45 |
| Long-Term Debt to Equity | 103.923 |
| Long-Term Debt to Total Capital | 46.201 |
Deutsche Lufthansa Ag in the News

Austrian Airlines plane severely damaged after flying through hailstorm
An Austrian Airlines Airbus 320 plane was damaged after it flew through a "thunderstorm cell" while approaching Vienna on Sunday, the airline says.

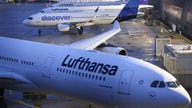
Lufthansa confirms 'rough landing' by Boeing 'training flight' caught on camera bouncing off LAX runway
A Lufthansa Boeing plane from Frankfurt, Germany made a rough landing at LAX earlier this week, during what the airline called a "training flight."
Airline cuts flights to Tehran as Middle East on alert for Iranian strike on Israel
Germain airline Lufthansa has suspended flights to Tehran through April 13 as the Middle East braces for an Iranian retaliatory strike on Israel.
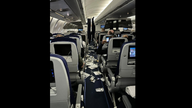
7 Lufthansa passengers on Texas to Germany flight hospitalized after lightning strikes plane
A Lufthansa flight heading from Austin, Texas, to Frankfurt, Germany, was diverted to Dulles International Airport after encountering "severe turbulence,” which left 7 people injured.
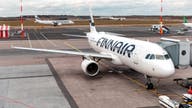
Finnair, international airlines prohibit fabric masks in favor of surgical masks
Commercial airline passengers who wish to travel abroad during the coronavirus pandemic need to double-check their chosen face mask fits current policies.