About bp plc - BP
BP At a Glance
| Phone | 44-20-7496-4000 | Revenue | 189.78B | |
| Industry | Integrated Oil | Net Income | 55.13M | |
| Sector | Energy Minerals | 2025 Sales Growth | 0.271% | |
| Fiscal Year-end | 12 / 2026 | Employees | 93,700 | |
| View SEC Filings |
BP Valuation
| P/E Current | 32.278 |
| P/E Ratio (with extraordinary items) | N/A |
| P/E Ratio (without extraordinary items) | 1,669.712 |
| Price to Sales Ratio | 0.485 |
| Price to Book Ratio | 1.678 |
| Price to Cash Flow Ratio | 3.75 |
| Enterprise Value to EBITDA | 4.747 |
| Enterprise Value to Sales | 0.785 |
| Total Debt to Enterprise Value | 0.487 |
BP Efficiency
| Revenue/Employee | 2,025,373.014 |
| Income Per Employee | 588.351 |
| Receivables Turnover | 6.87 |
| Total Asset Turnover | 0.677 |
BP Liquidity
| Current Ratio | 1.263 |
| Quick Ratio | 0.984 |
| Cash Ratio | 0.456 |
BP Profitability
| Gross Margin | 17.095 |
| Operating Margin | 6.801 |
| Pretax Margin | 3.765 |
| Net Margin | 0.029 |
| Return on Assets | 0.02 |
| Return on Equity | 0.098 |
| Return on Total Capital | 0.044 |
| Return on Invested Capital | 0.045 |
BP Capital Structure
| Total Debt to Total Equity | 136.713 |
| Total Debt to Total Capital | 57.755 |
| Total Debt to Total Assets | 26.04 |
| Long-Term Debt to Equity | 125.099 |
| Long-Term Debt to Total Capital | 52.827 |
Bp Plc in the News

CA lawmakers outraged at plan to divert gas tax revenue to ‘VIP' Olympics lanes
California's plan to create Olympic VIP lanes using gas tax revenue sparks debate between Republicans demanding road improvements and officials defending the 2028 Los Angeles investment

IndyCar driver Conor Daly goes racing with ampm for the Indy 500
Conor Daly will have ampm represented on his vehicle as he drives the No. 76 car at the Indianapolis 500 Sunday. He spoke to FOX Business about the partnership

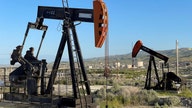
Investors fear Big Oil could cut share buybacks as crude prices slump
Oil is now hovering around $66 a barrel, prompting analysts to model scenarios where prices remain in the $60s this year or even decline into the $50s.

Hurricane Milton drives gas shortage in Florida as residents flee storm
Hurricane Milton is already impacting the fuel supply in Florida with pumps near Tampa and Orlando running dry as people flee to safer areas.
BP manager's husband pleads guilty to insider trading, listened in on wife's work calls
The husband of a former BP mergers and acquisitions manager pleaded guilty to insider trading after profiting $1.7 million on trades he had made based on listening in on her calls.

BP says interim CEO now permanent after predecessor resigned for failing to disclose personal relationships
Murray Auchincloss, the interim CEO who took over BP after Bernard Looney resigned from his post last September, is now permanent, the company says.

Chevron CEO says Houthi attacks in Red Sea pose 'very real' risks to oil flows and prices
Chevron CEO Michael Wirth said he is surprised U.S. crude oil is trading under $73 a barrel and that Houthi attacks in the Red Sea pose a "very real" risk to oil prices.
Ships turning off tracking systems to avoid Red Sea attacks: report
Some ships in the Red Sea, where cargo vessels have come under attack by Yemen's Houthi rebels in recent days, apparently are trying to evade detection.

Investors rebuff 'Big Oil' climate shareholder resolutions
U.S. investors at leading energy firms rejected a climate activist group's push to align emission targets with the Paris climate pact despite the group's success in Europe.
California goes to war with oil and gas giants over climate change 'deception'
The state of California has filed a lawsuit against major oil and gas companies, alleging the fossil fuel industry has lied about the harms of climate change for decades.