stonebridge acquisition ii corp - APAC

APAC

Close Chg Chg %
N/A N/A NaN%

Closed Market

10.16

N/A (NaN%)

Volume: 33.00

Last Updated:

Jun 26, 2026, 4:00 PM EDT

Company Overview: stonebridge acquisition ii corp - APAC

APAC Key Data

Open

$10.16

Day Range

10.16 - 10.16

52 Week Range

N/A - N/A

Market Cap

$81.63M

Shares Outstanding

8.05M

Public Float

6.13M

Beta

0.02

Rev. Per Employee

N/A

P/E Ratio

269.68

EPS

$0.09

Yield

0.00%

Dividend

N/A

EX-DIVIDEND DATE

SHORT INTEREST

N/A

AVERAGE VOLUME

2.58K


APAC Performance

1 Week
 
0.20%
 
1 Month
 
0.20%
 
3 Months
 
1.00%
 
1 Year
 
N/A
 
5 Years
 
N/A
 

APAC Analyst Ratings

  • Sell
  • Under
  • Hold
  • Over
  • Buy
Number of Ratings
Full Ratings ➔

About stonebridge acquisition ii corp - APAC

StoneBridge Acquisition II Corp. is a blank check company. It was formed for the purpose of effecting a merger, amalgamation, share exchange, asset acquisition, share purchase, reorganization or similar business combination with one or more businesses. The company was founded on June 19, 2024 and is headquartered in New York, NY.

APAC At a Glance

StoneBridge Acquisition II Corp.
One World Trade Center
New York, New York 10007
Phone 1-646-314-3555 Revenue 0.00
Industry Financial Conglomerates Net Income 302.33K
Sector Finance Employees 2
Fiscal Year-end 12 / 2026
View SEC Filings

APAC Valuation

P/E Current 269.681
P/E Ratio (with extraordinary items) N/A
P/E Ratio (without extraordinary items) 264.628
Price to Sales Ratio N/A
Price to Book Ratio 1.367
Price to Cash Flow Ratio N/A
Enterprise Value to EBITDA -317.515
Enterprise Value to Sales N/A
Total Debt to Enterprise Value 0.00

APAC Efficiency

Revenue/Employee N/A
Income Per Employee 151,162.50
Receivables Turnover N/A
Total Asset Turnover N/A

APAC Liquidity

Current Ratio 12.213
Quick Ratio 12.213
Cash Ratio 11.029

APAC Profitability

Gross Margin N/A
Operating Margin N/A
Pretax Margin N/A
Net Margin N/A
Return on Assets 1.03
Return on Equity 1.032
Return on Total Capital 0.516
Return on Invested Capital 1.032

APAC Capital Structure

Total Debt to Total Equity 0.00
Total Debt to Total Capital 0.00
Total Debt to Total Assets 0.00
Long-Term Debt to Equity N/A
Long-Term Debt to Total Capital N/A
  • Income Statement
  • Balance Sheet
  • Cash Flow Statement

Annual Financials for Stonebridge Acquisition Ii Corp - APAC

Collapse All in section
All values USD millions. 2024 2025 5-year trend
Sales/Revenue
- - - -
-
Sales Growth
- - - -
-
Cost of Goods Sold (COGS) incl D&A
- - - -
-
COGS excluding D&A
- - - -
-
Depreciation & Amortization Expense
- - - -
-
Depreciation
- - - -
-
Amortization of Intangibles
- - - -
-
COGS Growth
- - - -
-
Gross Income
- - - -
-
Gross Income Growth
- - - -
-
Gross Profit Margin
- - - -
-
2024 2025 5-year trend
SG&A Expense
- - 7.67K 250.69K
-
Research & Development
- - - -
-
Other SG&A
- - 7.67K 250.69K
-
SGA Growth
- - - +3,166.32%
-
Other Operating Expense
- - - -
-
Unusual Expense
- - - -
-
EBIT after Unusual Expense
- - (7.68K) (250.69K)
-
Non Operating Income/Expense
- - 108 553.02K
-
Non-Operating Interest Income
- - 108 4.62K
-
Equity in Earnings of Affiliates
- - - -
-
Interest Expense
- - - -
-
Interest Expense Growth
- - - -
-
Gross Interest Expense
- - - -
-
Interest Capitalized
- - - -
-
Pretax Income
- - (7.57K) 302.32K
-
Pretax Income Growth
- - - +4,095.31%
-
Pretax Margin
- - - -
-
Income Tax
- - - -
-
Income Tax - Current - Domestic
- - - -
-
Income Tax - Current - Foreign
- - - -
-
Income Tax - Deferred - Domestic
- - - -
-
Income Tax - Deferred - Foreign
- - - -
-
Income Tax Credits
- - - -
-
Equity in Earnings of Affiliates
- - - -
-
Other After Tax Income (Expense)
- - - -
-
Consolidated Net Income
- - (7.57K) 302.32K
-
Minority Interest Expense
- - - -
-
Net Income
- - (7.57K) 302.32K
-
Net Income Growth
- - - +4,095.31%
-
Net Margin Growth
- - - -
-
Extraordinaries & Discontinued Operations
- - - -
-
Discontinued Operations
- - - -
-
Net Income After Extraordinaries
- - (7.57K) 302.32K
-
Preferred Dividends
- - - -
-
Net Income Available to Common
- - (7.57K) 302.32K
-
EPS (Basic)
- - -0.0011 0.0376
-
EPS (Basic) Growth
- - - +3,518.18%
-
Basic Shares Outstanding
- - 7.02M 8.05M
-
EPS (Diluted)
- - -0.0011 0.0376
-
EPS (Diluted) Growth
- - - +3,518.18%
-
Diluted Shares Outstanding
- - 7.02M 8.05M
-
EBITDA
- - (7.68K) (250.69K)
-
EBITDA Growth
- - - -3,164.19%
-
EBITDA Margin
- - - -
-

Stonebridge Acquisition Ii Corp in the News

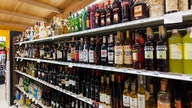
Hard liquor can take the edge off inflation

Liquor companies are taking inflation in their stride. A push into premium brands, coupled with the fact that more drinkers are switching to spirits from beer in key markets, should help maintain their edge.