About abbott laboratories - ABT
ABT At a Glance
| Phone | 1-224-667-6100 | Revenue | 44.33B | |
| Industry | Medical Specialties | Net Income | 6.50B | |
| Sector | Health Technology | 2025 Sales Growth | 5.669% | |
| Fiscal Year-end | 12 / 2026 | Employees | 115,000 | |
| View SEC Filings |
ABT Valuation
| P/E Current | 24.469 |
| P/E Ratio (with extraordinary items) | N/A |
| P/E Ratio (without extraordinary items) | 33.694 |
| Price to Sales Ratio | 4.941 |
| Price to Book Ratio | 4.174 |
| Price to Cash Flow Ratio | 22.89 |
| Enterprise Value to EBITDA | 19.758 |
| Enterprise Value to Sales | 5.072 |
| Total Debt to Enterprise Value | 0.063 |
ABT Efficiency
| Revenue/Employee | 385,460.87 |
| Income Per Employee | 56,521.739 |
| Receivables Turnover | 5.591 |
| Total Asset Turnover | 0.527 |
ABT Liquidity
| Current Ratio | 1.576 |
| Quick Ratio | 1.183 |
| Cash Ratio | 0.542 |
ABT Profitability
| Gross Margin | 52.727 |
| Operating Margin | 18.643 |
| Pretax Margin | 19.099 |
| Net Margin | 14.663 |
| Return on Assets | 7.732 |
| Return on Equity | 13.027 |
| Return on Total Capital | 9.809 |
| Return on Invested Capital | 10.472 |
ABT Capital Structure
| Total Debt to Total Equity | 27.117 |
| Total Debt to Total Capital | 21.332 |
| Total Debt to Total Assets | 16.302 |
| Long-Term Debt to Equity | 20.769 |
| Long-Term Debt to Total Capital | 16.339 |
Abbott Laboratories in the News

7 deaths linked to faulty blood glucose monitors as FDA issues safety warning
FDA warns Abbott's FreeStyle Libre 3 blood glucose sensors linked to seven deaths, 736 injuries due to incorrect readings from manufacturing defect.
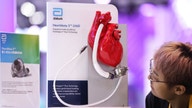
Heart pumps tied to 14 deaths, hundreds of injuries are being recalled
Federal health officials said that nearly 14,000 heart devices tied to hundreds of injuries and more than a dozen deaths are being voluntarily recalled.
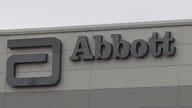
Abbott Labs under criminal investigation over baby formula shortage: Report
The Department of Justice announced an investigation into Abbott Laboratories' Michigan plant which was at center of a nationwide formula shortage in 2022.

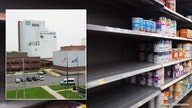
Baby formula shortage stretches into eighth month
While stocking rates of baby formula have slowly been improving, certain supply is still struggling to rebound.
Abbott recalls several ready-to-feed liquid baby formula
Abbott is recalling several of its ready-to-feed baby formula products due to a bottle defect that could result in the product being spoiled.

Biden administration attempts to diversify US baby formula market amid shortage
The FDA announced on Wednesday their continued efforts to diversify the baby formula market by allowing foreign manufacturers to continue to export formula to the U.S.

White House announces import of baby formula from Australia
The U.S. Food and Drug Administration announced that 1.25 million cans of baby formula will be delivered to the United States within the coming weeks and months.
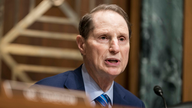
Baby formula crisis: Dem lawmaker questions Abbott on how it spent savings from GOP tax cuts
Democratic Sen. Ron Wyden, D-Ore., is questioning Abbott Laboratories' business practices after the shutdown of one of the company's plants exacerbated the baby formula shortage in the U.S.

Baby formula maker fills supply gap
While the U.S. is likely months away from seeing more baby formula back on the shelves, one company is looking to help fill the gap.

Pelosi says 'indictment' might be needed over baby formula shortage
House Speaker Nancy Pelosi said Tuesday that "there might be need for indictment" over the ongoing baby formula shortage in the U.S.