


What is Volume in Stock Trading?
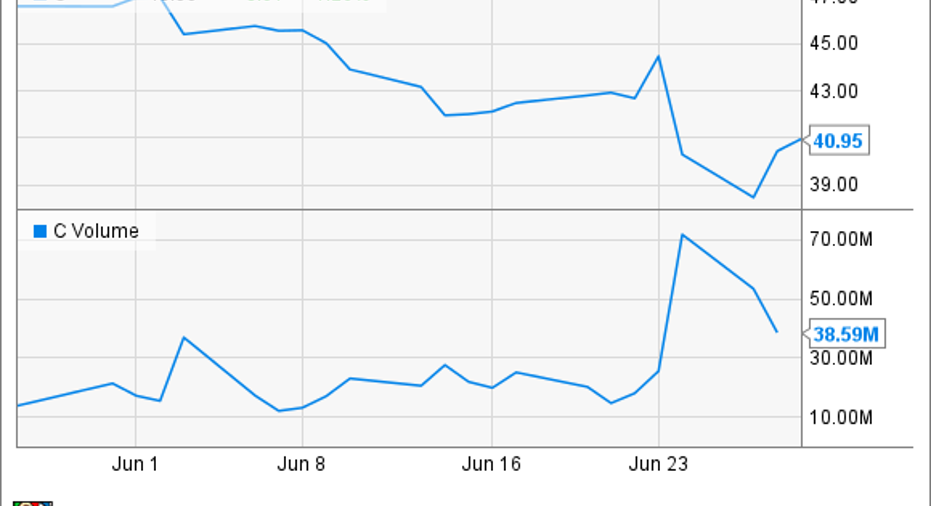
Image Source: Getty Images
A stock's volume refers to the number of shares that are sold, or traded, over a certain period of time (usually daily). A high daily volume is common when stock-specific news items are released or when the market moves significantly, while a low daily volume can occur on light-news days and calm days for the stock market.
What is volume?
Broadly speaking, volume in investing means the total amount of a security that changes hands over a given period of time. This can refer to shares of an individual stock, the number of options contracts traded, or the total number of shares exchanged within an index or an entire stock market. Daily volume is the most commonly used time period, but volumes over longer or shorter periods of time can be useful as well.
It's important to note that when counting volume, each buy/sell transaction is counted only once. In other words, if one investor sells 1,000 shares and another investor buys those 1,000 shares, it will count as volume of 1,000 shares, not 2,000. This may sound obvious, but it's a rather common misconception.
For investors, it's helpful to know that volume generally gets higher when an investment's price is changing. Certain events, such as the company's earnings report or a major news release, can cause volume to spike and can lead to a large move in either the positive or negative direction. If the entire market is crashing or rising rapidly, it can also lead to higher volume across the market.
In addition, technical analysts use a stock's volume in order to determine the best entry and exit points for a trade.
A real-world example of trading volume
To illustrate this, consider Citigroup stock, whose average daily volume over the 30 days prior to this writing was just over 24 million shares. This means that on the typical trading day, 24 million shares of Citigroup stock change hands.
As you can see in the chart below, there was a massive volume spike on June 24, the day the "Brexit" vote sent shockwaves through the market. In fact, volume spiked to more than 70 million shares on that day. Notice how on the same day, and on the following day which also had high volume, Citigroup's stock price had its largest two-day move of the month. This is not a coincidence the uncertainty from the Brexit vote caused lots of investors to sell, which pushed the price down.
Also notice how other, smaller volume spikes in the chart took place on days with relatively large stock price movements. The volume spike during the first week of June is a good example.
This article is part of The Motley Fool's Knowledge Center, which was created based on the collected wisdom of a fantastic community of investors. We'd love to hear your questions, thoughts, and opinions on the Knowledge Center in general or this page in particular. Your input will help us help the world invest, better! Email us atknowledgecenter@fool.com. Thanks -- and Fool on!
The article What is Volume in Stock Trading? originally appeared on Fool.com.
the_motley_fool has no position in any stocks mentioned. The Motley Fool has no position in any of the stocks mentioned. Try any of our Foolish newsletter services free for 30 days. We Fools may not all hold the same opinions, but we all believe that considering a diverse range of insights makes us better investors. The Motley Fool has a disclosure policy.
Copyright 1995 - 2016 The Motley Fool, LLC. All rights reserved. The Motley Fool has a disclosure policy.