


Valeant Pharmaceuticals' Stock in 4 Charts
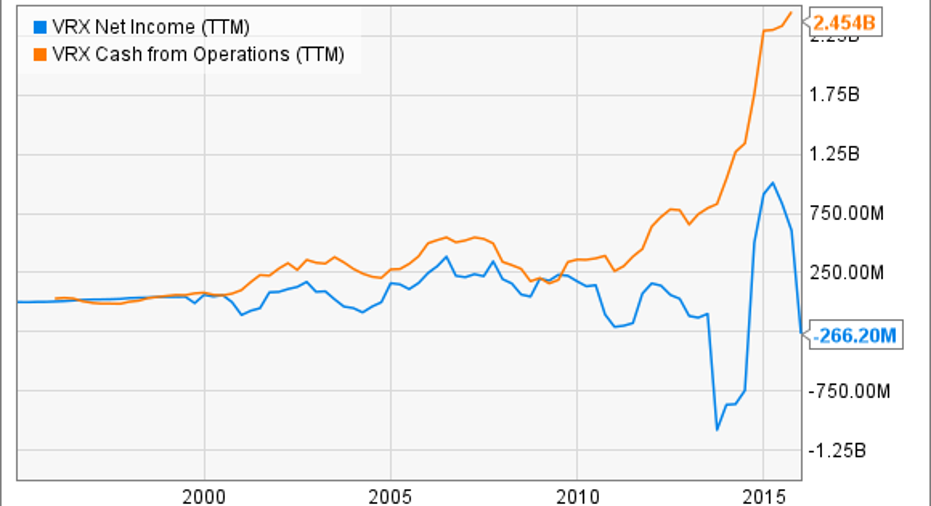
Image source: Pixabay, public domain
For this Fool, the rise and fall of Valeant Pharmaceuticals International Inc (NYSE: VRX) is the most fascinating business story of 2015 -- and there are still a few chapters yet to be written. Below, I've put together four charts that try to explain what happened to the stock and why.
VRX Total Return Price data by YCharts
Rise and fallJ. Michael Pearson was named CEO of Valeant on Feb. 4, 2008, effective retroactively to the start of the month. Under his tenure, the stock had looked unstoppable.
Under the former McKinsey partner, the company adopted an aggressive acquisition strategy that had Valeant raising the prices of acquired drugs and slashing research and development budgets. Wall Street was smitten with this "innovative" business strategy -- not to mention the generous acquisition fees it produced.
One prominent hedge fund manager labeled Valeant a "platform company" and compared it to Warren Buffett'sBerkshire Hathaway!
By the time the stock peaked at $260.05 last Aug. 5, Valeant's stock had returned a blistering 53% on an annualized basis.
However, since then, it has given up the bulk of those gains under a barrage of negative surprises and disastrous exposure, which have left investors (and the stock) reeling, and their faith in the company's business model in tatters. From its peak, roughly $80 billion in market value evaporated.
Today, Valeant's stock is still ahead of the S&P 500 and theHealth Care SPDR ETF(red line and orange line above, respectively) over the period of Pearson's tenure (which will end once a replacement is found), but the gap has narrowed dramatically.
Leverage is a two-edged swordThe frenetic pace of acquisitions at Valeant had to be sustained with somebody's money: shareholders', naturally, but the company also issued significant amounts of debt to finance deals.
VRX Debt to Equity Ratio (Quarterly) data by YCharts
From having net cash on its balance sheet at the end of 2007 (not shown, as the graph begins in 2010), Valeant ended the third quarter of 2015 with nearly $30 billion in net debt (orange line), pushing the debt-to-equity ratio to an eye-watering five-to-one (blue line).
Now that Valeant needs to rethink its entire business model, investors are quite legitimately asking how the company intends to pay that debt.
Leverage, at one point a fuel for growth, is turning into a vice. On Thursday, Standard & Poor's Ratings Services lowered Valeant's credit rating to B from B-plus after the company was served a notice of default for failing to file its annual report in time.
Quality of earnings (part one)Comparing the income statement and the cash flow statement can provide some useful insights into the quality of the firm's earnings. Here, we see that, beginning in 20011, revenues start to grow significantly faster than cash-based measures of profitability: cash from operations, free cash flow per share, and cash flow from operations per share. This indicates that, simultaneous with Valeant's aggressive expansion, cash profitability is falling.
VRX Revenue (Quarterly) data by YCharts
Quality of earnings (part two)In 1999, Howard Schilit, forensic accountant and author of the excellentFinancial Shenanigans: How to Detect Accounting Gimmicks and Fraud in Financial Reports, told a gathering of the New York Society of Security Analysts:
VRX Net Income (TTM) data by YCharts
From the chart above, we can see that Valeant's net income tracked cash flows from operations pretty closely until 2010 when it began to diverge wildly.
If you go to Valeant's cash flow statements, you'll find that rising depreciation and amortization charges account for the bulk of the gap between the two measures. Furthermore, these charges relate largely to intangible assets (product rights and brands, for example) and goodwill.
For a serial acquirer like Valeant, goodwill, which represents the excess of the price paid for acquired assets over their net asset value, is a key item. On Sep. 30 of last year, the company had $17.4 billion in goodwill, representing more than a third of total assets (and approaching three times shareholders' equity).
Does the fact that depreciation and amortization charges (which include impairment charges to acquired assets) blew up indicate a problem at Valeant?
Not necessarily, but it highlights how hard it is to get at its true profitability, because when it comes to the valuation of intangible assets, including goodwill, you're going to have to trust the company. When it comes to Valeant, that position is increasingly uncomfortable to maintain.
The article Valeant Pharmaceuticals' Stock in 4 Charts originally appeared on Fool.com.
Alex Dumortier, CFA has no position in any stocks mentioned. The Motley Fool owns shares of and recommends Berkshire Hathaway and Valeant Pharmaceuticals. Try any of our Foolish newsletter services free for 30 days. We Fools may not all hold the same opinions, but we all believe that considering a diverse range of insights makes us better investors. The Motley Fool has a disclosure policy.
Copyright 1995 - 2016 The Motley Fool, LLC. All rights reserved. The Motley Fool has a disclosure policy.