


Tech rally not in danger of a dot-com bust
Even with some selling pressure on Thursday, technology stocks and several sector-related exchange traded funds remain the best performing areas of the S&P 500 so far this year, drawing comparisons to the infamous dot-com era bubble. However, the current tech bull market has more going for it and may not succumb to a disastrous end like the dot-com bust.
The tech-heavy PowerShares QQQ (NasdaqGM: QQQ), which tries to reflect the performance of the Nasdaq 100, has increased 22.1% year-to-date, compared to the 10% gain in the S&P 500.
John Q. Frank, QQQ Equity Product Strategist for PowerShares by Invesco, though, argued that investors concerned about the sudden outperformance in tech names should not be too concerned as fundamentals still support the sector.
"While technology has delivered the best sector performance within the S&P 500 Index over the past three years (July 29, 2014, through June 29, 2017), we are still nowhere near the bubble status of 17 years ago," Frank said in a research note.
Frank pointed to three factor that may continue to support the ongoing technology sector outlook, including valuations, cash and marketable securities and trailing returns.
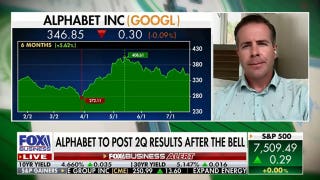
For starters, when comparing valuations, Frank looked at the so-called Power Five - Apple (NasdaqGS: AAPL), Alphabet (NasdaqGS: GOOGL), Microsoft (NasdaqGS: MSFT), Amazon (NasdaqGS: AMZN) and Facebook (NasdaqGS: FB) - and found that valuations remain relatively grounded compared to the high-flying pricing during the dot-com bubble. Today's Power Five trade at an aggregate of 30 times trailing earnings, compared with the aggregate of 78 times trailing earnings for the five largest tech stocks in March 2000.
Another significant difference between the current tech rally and the previous tech bubble can be seen through liquid assets. Cash and marketable securities make up 18.3% of the Power Five's aggregate market capitalization, compared to 2.3% for the largest companies during the tech bubble. Companies today have a much larger cushion to fall back on should times grow hard.
Lastly, while tech companies have stood out in recent years, they have not run off like they did during the tech boom. Through June 19, 2017, the average trailing one-year return for the Power Five was 45.3% and the cumulative three-year trailing return averaged 107.6%. In contrast, the average performance of the five largest stocks during the tech bubble was 184.2% over the trailing 12 months and a huge 611.9% over the trailing three years.
As more grow concerned over the high flying prices and start to voicing concerns over another dot-com-esque bubble, potential investors should keep in mind that the current technology segment is no where near the lofty valuations compared to the dot-com era.
This article was provided courtesy of our partners at etftrends.com.