


Oil's Well that Ends Well
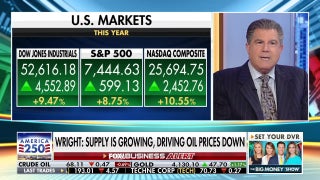
Petroleum persists in dominating the headlines while the news hasn’t varied much for weeks. Crude supplies are presently massive, no one player can or will stop the gush, and markets are anxious as fragile credit markets, fuel dependent sovereign markets, and big oil's curbing of capital spending casts a dark, gloomy shadow over any resultant virtues – the average American pocketing $75.00 per month in gasoline savings, along with last week’s robust retail sales and Michigan confidence numbers.
Tormented Atoms in a Bed of Sand
West Texas Intermediate (WTI) began 2014 at $90.00 and quickly pursued an ambitious pathway - an uneven flight of steps to a mid-year landing of $102.50 predicated on a harmonious surety of 3.50-4.0% nominal global GDP growth which, in turn, would adroitly siphon off 1.4MM barrels per day of demand growth. Like a New Jersey boardwalk funhouse of old, consensus cautiously treaded along numerous lopsided floors while gazing upon two-way mirrors masquerading as potential wars of every conceivable stripe, unscheduled refinery maintenance, potential port shut-offs, and an enormous impending congestion problem in Cushing, Oklahoma – a dizzying expanse of risk for any one market to bear. Oil continued its climb while participants tripped out of the funhouse with fear that appearances were indeed super bullish. There was no other way.
What followed across the last six months correlates with outliers rivaling the “Battle of Muret”, “Dewey beats Truman” or the “2004 Boston Red Sox” and bears weight to Voltaire’s quip describing man as a stranger to his own research. With the petroleum markets in view, most of us knew not whence he comes, nor whither he goes! We were collectively painting on paper whose frame didn’t match the room.
Nominal global GDP growth fell to earth presenting a new normal slightly above the “3.0%” handle causing dominoes to scatter arresting 200,000-300,000 BPD demand growth in the process. We were reliant on hot growth countries including India and Indonesia to lead the demand procession yet, didn’t foresee the noxious effect of currency devaluations, the reduction and/or the elimination of fuel product subsidizes, or the fading confidence in China.
Markets started to shrug whispers of vulnerability yet didn’t crack as we nervously flipped newspaper pages telling us tales of the supply risks from faraway lands including Algeria, Libya and Nigeria marinating with renewed distractions from Iran, Iraq, and Russia. The hazards were severe and despite demand destruction oil will be resigned to hold firm.
Nothing new under the sun
Since the mid-1970’s there have been a half-dozen oil declines similar in enormity to what we’ve witnessed this year. According to recent history, when decreases were the result of increased production, the stock market generally behaved well. When declines coincided with apathetic growth prospects, stocks usually suffered. There is no doubt there are portions of both demand and supply this time around but – presently it appears we are skewed towards over supply rather than lack of demand. At some point the market will come to terms with the reality that this is yet another cycle – one that the markets will eventually digest.
Value trap?
While the petroleum market calibrates towards a “new normal” it’s worth acknowledging that everyone you talk to seems sufficiently bearish on the oil price. They indeed may be right however, imagine the enormous upside trading potential if OPEC startles us with a production cut, if demand demonstrates brisker price elasticity than forecasted, if there’s a meaningful supply disruption. The rubber band is extremely taut. It’s always darkest before dawn.
Over the last 25 years, I’ve been burned by the “value trap” and select energy stocks may well be added to that list of yet another premature investment thesis. However, if you expect eventual recovery in petroleum fundamentals you might consider expressing that conviction through the sale of put options as energy related implied options volatility remains at staggering levels.
My personal favorite continues to be Schlumberger (SLB) – a stellar name in the oil services industry who appears well-positioned to bear the current pricing and to deliver low cost service given their immense scale, balance sheet, and reputation. For those casually bullish on Schlumberger, I would recommend selling the January $77.50 put for $3.00 per share (reference $79.90). If SLB should remain above $77.50 over the next four weeks, you will pocket $300 for each contract sold (each contract equals 100 shares of stock). If SLB should drop below $77.50, you will be forced to purchase SLB at $77.50 although your actual purchase price would be $74.50 per share ($77.50 strike price minus $3.00 premium per share = $74.50). If SLB should catch a bid and rally back to historical levels, your put premium received may pale in comparison to what could’ve been if you had simply purchased the stock in the first place.
It’s been said that Wall Street graves are full of those who were right too early.