Check Point Software Technologies' Results Deserve Closer Inspection

Did Check Point Software Technologies Ltd. have a good quarter? The initial downward stock market reaction after the company reported this morning would indicate no, but given the moving parts in its numbers and how its near-term earnings are being affected by long-term strategic decisions, the answer might not be so simple to discern. Let's take a closer look at what went on with Check Point's first-quarter results and its guidance.
Check Point Software's first quarter Revenue of $404 million came in ahead of the bottom of management's guidance for $395 million to $410 million, and non-GAAP EPS of $1.06 was above the $0.99 to $1.05 range given on the previous earnings call.
That's all well and good, but the market may not have been impressed with the guidance numbers, or at least the headline guidance numbers:
- Second-quarter revenue of $405 million to $435 million, representing growth of 2.4% to 10%.
- Second-quarter non-GAAP EPS of $1.02 to $1.09, representing growth of 3% to 10%.
- Full-year guidance unchanged with revenue expected to be $1,720 million to $1,790 million and non-GAAP EPS of $4.45 to $4.60.
- Management noted its caution on the IT spending environment saying it was "hard to predict the future."
Aside from the cautionary remarks, the revenue forecast is probably what scared the market. The midpoint of second-quarter revenue guidance implies a year-over-year growth rate of 6.2%, compared to the 8.5% recorded in the first quarter. Given that operating income margin declined to 50% from 52.9% in the same period last year, is Check Point's growth slowing at a time of declining margin?
Delving into the detail Not so fast. For the following three reasons, the reality is somewhat different than the headline numbers suggest.
First, revenue isn't necessarily the best way to judge Check Point's progress. The company reports revenue from three different streams, a breakout of which can be seen in the table below. Essentially, Check Point operates a so-called razor-and-blade model, whereby hardware products are sold that then help generate software blade sales and software and maintenance sales.
| Revenue (in thousands of dollars) | Gross Profit (in thousands of dollars) | Gross Margin | Revenue Growth | |
|---|---|---|---|---|
|
Products and licenses |
122,730 |
99,691 |
81.2% |
7.3% |
|
Software blades subscriptions |
88,128 |
86,310 |
97.9% |
18.5% |
|
Software updates and maintenance |
193,413 |
173,807 |
89.9% |
5.2% |
|
Total |
404,271 |
359,808 |
88.9% |
8.5% |
ALL DATA FOR THE FIRST QUARTER. DATA SOURCE: CHECK POINT SOFTWARE TECHNOLOGIES LTD. PRESENTATIONS.
However, products are also sold bundled with software blades, and Check Point is adding more and more new blades to the bundles it sells. Moreover, there is a key difference between product and license sales and software blade sales. The former is immediately recognized in the profit and loss figures, but much of the latter's subscription revenue is recognized over time.
Therefore, as Check Point adds more software blades to its product/blades bundles, more revenue will get shifted to its deferred revenue line (on the balance sheet) from its product revenue (profit and loss). Indeed, management said that in the second quarter, $5 million to $10 million would be shifted in this manner.
Adding the midpoint of this estimate ($7.5 million) to the midpoint of second-quarter revenue guidance of $405 million to $435 million produces revenue guidance of $427.5 million, representing year-over-year growth of 8.2% -- a healthier number than the midpoint figure of 6.2% discussed above.
As you can see below, growth rates remain strong for software blade subscriptions:
DATA SOURCE: CHECK POINT SOFTWARE TECHNOLOGIES LTD. PRESENTATIONS.
Second, operating income margin is in decline partly because Check Point is investing in sales and marketing in order to drive future growth. For example, selling and marketing expenses increased 21% to $91.8 million in the quarter, driving an overall operating expenses increase of 15%. In a sense, this is a sign of increasing competition, confirmed as rival network security company is doing the same thing. Fortinet's fourth-quarter 2015 sales and marketing expenses increased a whopping 47% as the company seeks to expand its installed base.
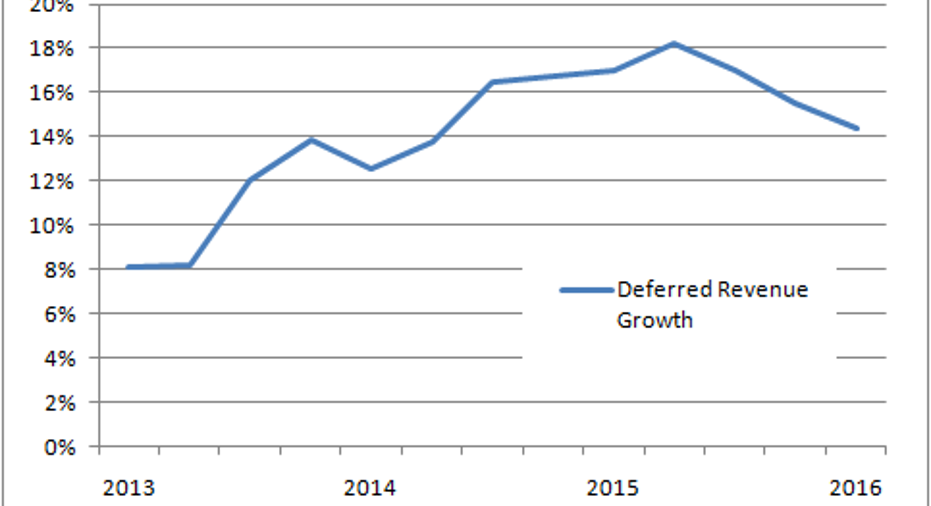
Third, other key metrics increased handsomely for Check Point in the quarter. As you can see below, deferred revenue growth of 14% in the quarter keeps up the track record of mid-teen rate increases. Meanwhile, operating cash flow increased 13.4% in the quarter -- a far greater number than the operating income growth rate of 2.6%.
DATA SOURCE: CHECK POINT SOFTWARE TECHNOLOGIES LTD. PRESENTATIONS.
The bottom line Check Point's headline guidance may have disappointed, but when adjusted for the anticipated shift from product to deferred revenue, it looks a lot better. Management has also in the past proved conservative in guidance. Meanwhile, cash flow and deferred revenue remains strong.
The article Check Point Software Technologies' Results Deserve Closer Inspection originally appeared on Fool.com.
Lee Samaha has no position in any stocks mentioned. The Motley Fool owns shares of and recommends Check Point Software Technologies. Try any of our Foolish newsletter services free for 30 days. We Fools may not all hold the same opinions, but we all believe that considering a diverse range of insights makes us better investors. The Motley Fool has a disclosure policy.
Copyright 1995 - 2016 The Motley Fool, LLC. All rights reserved. The Motley Fool has a disclosure policy.


