


3 Graphs Prove the Risk of Recession Is Real
U.S. stocks were higher on Monday, with theS&P 500and theDow Jones Industrial Average (DJINDICES: $INDU)up 0.49% and 0.64%, respectively, at 4:05 p.m. EDT.
3 graphs that show the risk of recession is genuine
JPMorgan Chase is sounding the alarm bell on recession risk. In the wake of a disappointing employment report for May, JPMorgan U.S. economist Jesse Edgerton wrote:
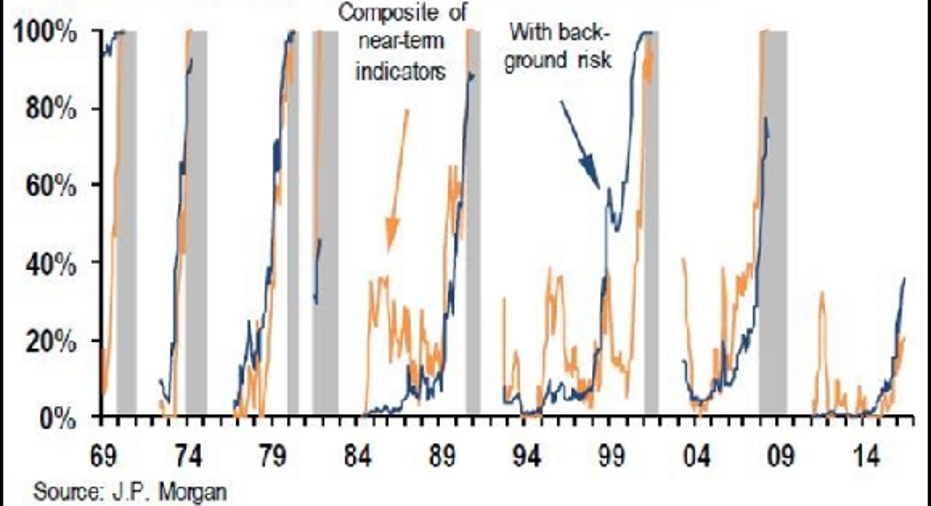
JPMorgan's "preferred macroeconomic indicator" (blue line in the graph below) aggregates a composite of near-term indicators (yellow line) and a medium-term recession risk model (termed "background risk"). The graph below suggests it has had some success in predicting recessions (when it was backtested, at any rate):
Image source: JPMorgan Chase.
(Note however, that at the start of 1999, the indicator was at the same level it is now, yet a recession was more than two years away -- it started in March 2001. The grey horizontal bars represent recessions.)
Still, JPMorgan's report acknowledges that the risk of recession based on a very popular indicator -- the shape of the yield curve -- is low: 9%, by its estimate.
Analysts and economists look at the spread between long rates and short rates -- typically the 10-year Treasury note yield and the three-month Treasury bill yield. When long rates fall below short rates, that spread becomes negative, and the yield curve is said to be "inverted." An inverted yield curve is thought to be a strong indicator of an imminent recession.
Indeed, the spread turned negative prior to the last seven recessions (including the 1990-1991 recession, though the negative spread doesn't show up in the graph, which only displays monthly values):
As of last Thursday, the spread was 1.52 percentage points -- comfortably positive and near the middle of its historical range. Of course, these are far from normal times, and the three-month Treasury bill rate is very far from its normal range. As the following graph shows, it's been12 recessions since we last saw the bill rate at these levels -- you need to go back (roughly) to the Japanese attack on Pearl Harbor:
With the three-month rate barely above zero, it's difficult to imagine the 10-year yield dipping below it, so it's reasonable to ask whether this indicator is still functioning in a zero-interest rate world. Indeed, the the last time the three-month rate was at or near current levels, the yield spread failed predict the recessions of 1937-38 and 1945 (it came nowhere close to negative -- in fact, it was consistently higher than it is today).
Combine that with two more observations --
- The yield spread is currently within the bottom 5% of its range since the start of 2011.
- Next month, the current economic expansion will enter its eighth year; it's already the third longest in recorded history after the ones in the 1990s (10 years), 1980s (seven years, eight months), and the 1960s (eight years, 10 months).
-- and it's easy enough to see why the risk of recession within the next 12 months appears to be more than an idle threat. How should long-term investors respond? Mostly with a shrug, although it could be worth considering keeping (or accumulating) a bit of dry powder in anticipation of economic uncertainty or hardship...or more attractive equity valuations.
Quote of the day
Upton Sinclair, the author, journalist and activist noted that, "[i]t is difficult to get a man to understand something, when his salary depends on his not understanding it."
Guy Moszkowski, a veteran research analyst with Autonomous Research, has updated Sinclair's adage for investment bankers. Commenting on the internal opposition Credit Suisse's new CEO, Tidjane Thiam, faces in reducing the bank's exposure to trading in favor of wealth management, Moszkowski told The New York Times:
Bread on the table and a summer home in the Hamptons -- both vital necessities of an investment banker.
The article 3 Graphs Prove the Risk of Recession Is Real originally appeared on Fool.com.
Alex Dumortier, CFA, has no position in any stocks mentioned. The Motley Fool has no position in any of the stocks mentioned. Try any of our Foolish newsletter services free for 30 days. We Fools may not all hold the same opinions, but we all believe that considering a diverse range of insights makes us better investors. The Motley Fool has a disclosure policy.
Copyright 1995 - 2016 The Motley Fool, LLC. All rights reserved. The Motley Fool has a disclosure policy.