MLB Fans Still Squeezed by Economy

Even America’s Pastime offers proof that American families are still feeling economic pain more than three years since the end of the Great Recession.
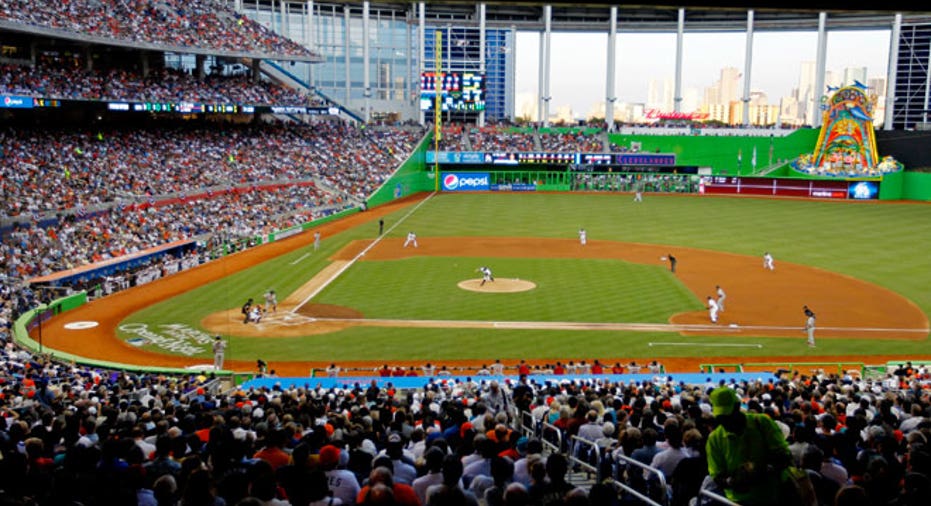
While it’s a nontraditional metric, dissecting Major League Baseball ticket sales offers a glimpse into the psyche of consumers and their willingness to spend on discretionary items.
It’s particularly helpful as an economic barometer because while MLB is clearly suffering from sagging popularity, it needs to lure fans to 81 home games a season. By comparison, it’s far easier to fill the seats in the National Football League’s short eight home game season.
Baseball fans also account for a large percentage of U.S. consumer spending as they tend to be middle to upper-middle class households that have families.
Even though 81% of household MLB fans have at least one college graduate and 42% make more than $75,000 a year, attendance remains below pre-crisis levels, according to a new report by ConvegEx. Baseball drew an average of 30,344 fans a game last year, up 0.7% from 2010, but still off 7.4% from the all-time high set in 2007 before the financial crisis struck.
Housing Still a Key Player
The most pain is understandably being felt in the cities hit the hardest by the housing crisis, which began in 2007 and ripped enormous chunks out of Americans’ wealth.
According to ConvergEx, the average stadium capacity utilization for the worst five cities (Phoenix, Miami, Tampa, Detroit and San Francisco) in the Case-Shiller’s 20-city home-price index was 67.3% last year.
That compares with an average capacity utilization of 77.8% for the top five cities: Dallas, Denver, Boston, Cleveland and New York. While both ends of the spectrum improved year-over-year, they were still off their respective peaks of the past decade.
“Team performance and the presence of star players can both affect game attendance, yet housing market conditions undeniably show the impact of financial stress on discretionary spending for items such as baseball tickets,” ConvergEx wrote.
uReport: Send photos and videos of you enjoying this baseball season!
Baseball and Football’s Diverging Fortunes
From an economic perspective, it’s not shocking to see baseball struggling to return to its pre-crisis glory. ConvergEx notes that the University of Michigan’s reading on consumer sentiment stands at 76.2, down 12.5% from 87.1 on Opening Day in 2007. It’s also off 19.1% from 2004, when MLB attendance climbed 8% year-over-year.
There are also a slew of non-economic factors weighing on MLB, highlighted by the surge in popularity of the NFL and changing demographics. For example, Gallup says baseball is the favorite sport of just 6% of 18-29 year-olds to watch, compared with 18% of senior citizens and 11% of people 50 to 64 years old.
While revenue for the 30 franchises rose 3.4% last season to an average of $212 million, operating income tumbled 13% to an average of $14 million as player costs rose 5.1%, according to Forbes.
By comparison, the NFL’s 32 teams generated an average of $261 million in revenue during the 2010 season, more than their baseball counterparts despite playing one-tenth as many games. That represented a 4% year-over-year rise and while operating income fell 8.1%, it still averaged more than double MLB’s at $30.6 million, according to Forbes.
Rising Prices
Like most sports, MLB has also hit fans with soaring ticket prices to cope with rising player salaries. Earlier this week the Reds, who play in the relatively small market of Cincinnati, signed 2010 MVP Joey Votto to a 10-year contract worth an eye-popping $225 million.
According to ConvergEx, the 2011 average MLB ticket price of $27 represents an incredible 205% surge compared with the 1991 average of just $8.84. The rise in ticket prices didn’t even take a break for 2009 when the U.S. experienced a brush with deflation. However, ConvergEx notes that ticket price growth slowed to a 20-year low last year of 1.2%.
It remains to be seen how ticket prices and fan attendance will respond to recent measurable improvements in the U.S. economy.
For example, nonfarm payrolls have soared by an average of 245,000 jobs a month in the three months of available data since the baseball season ended last year, according to the Bureau of Labor Statistics. That represents a 73% increase from an average gain of 141,000 jobs a month in the prior three month period.


