


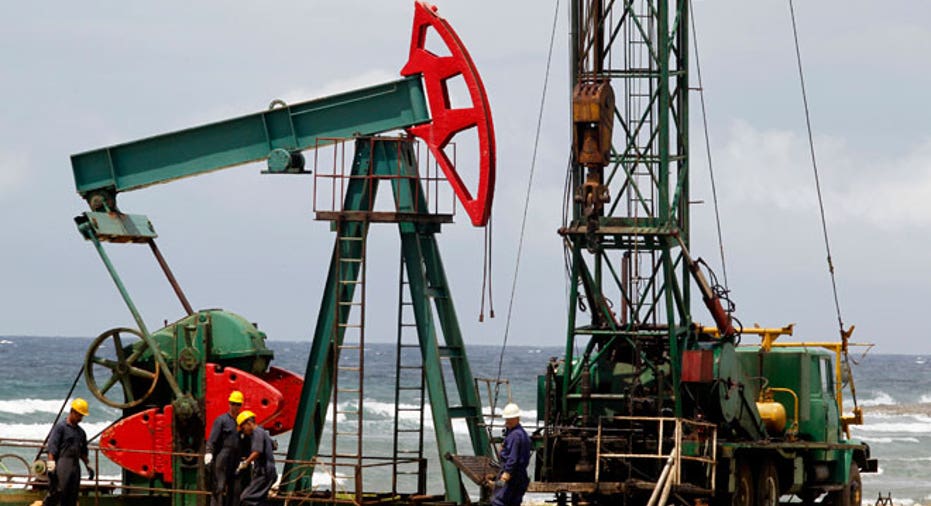
Petroleum Markets and the Supply of the Supply
December 2014 West Texas Intermediate (WTI) futures surge as traders continue to grapple with volatile markets and varying market convictions.
Unsuccessful Supply or Demand Indifference?
Some consider the crude collapse purely as the manifestation of positive supply-side surprises. The U.S. is still trending toward producing 1 million barrels of crude per day (BPD); consensus somehow overestimated the expected costs of production for U.S. shale oil, a minor yet unexpected rise in Iraqi and Libyan output and the reluctance of Saudi Arabia and Iran to cut their current output.
On the other hand, some will argue the falling crude price is fully indicative of the lackluster demand story. World-wide demand clearly decelerated this year at an approximate rate of 400,000 barrels per day, OECD country economies (except U.S.) are still struggling to remain somewhat expansionary, Latin America’s growth trajectory has slowed, and product demand (diesel, jet fuel, kerosene) noticeably so in China and India has just recently picked-up however, has occupied most of 2014 in negative demand territory.
Market Simply Out of Balance or Out of Whack?
At first glance, the 2014 West Texas Intermediate (WTI) futures price chart resembles a small solitary mountain. Prices began the year near $85.00 and gently sloped upwards to their $103.00 mid-summer summit. But they rolled back down – beneath the January $85.00 base - to the $80.00 area where they sit now.
However, if you traded WTI futures, you would undoubtedly think of the price swings in terms of hills! The intra-week trading landscape was hills. This is not to say simply that there were hills; there was nothing but hills! Every sharp move seemed to be at the top of the hill, at the bottom of the hill, or – like now – the side of a hill. The price action resembled a bunched-up bath towel.
Looking through the rear-view mirror, the market was flummoxed with U.S. crude production growth persisting at near one million barrels per day combined with an unexpected rebounding restart in production from countries such as Libya, Iran, and Nigeria that are (or, were recently) at-risk of civil war, sanctions, protests, etc. The end result was well more than 100 million barrels of global oil stock inventory builds in the first six months of this year.
The second half of 2014 began with a noticeable oversupply and, at the same time, a persistently deteriorating confidence in global economic growth – particularly in the emerging markets. Countries like China and India – once known for their resilient desire for oil product – went deafly silent.
The petroleum markets also had to digest a 7% surge in the U.S. dollar between March and September – eroding structural demand for oil products. On top of all this was perhaps the most peculiar happening of 2014 thus far : The apparent lack and therefore discarding of supply disruption fear – and thus, the lack of any noticeable embedded risk-premium. Market participants and industry alike somehow have gotten anesthetized to the many geopolitical headlines and subsequent disruption risks associated with domestic unrest, terrorism, civil wars, and economic sanctions.
Cure for Lower Prices is Sometimes Lower Prices
Placing things in appropriate context we must recall in 2013, global oil demand grew a smidgen more than 1% year-over-year, which was about two times the rate of 2012 along with consensus expectations going into last year! If nothing else, solid data for 2013 allows us to interpret the current underlying trends with a little more confidence and placing into context perhaps the zealousness or, unreasonable expectations we had coming in to 2014.
The petroleum market – in my opinion – is not at-present fully factoring in potential supply disruption risks. It is true that some of these perceived risk-country’s (e.g. Syria, Sudan, Libya) are not today producing near to their potential (especially compared to even five years ago) however, the domino effect of a one-off interference – not to mention a multi-year disruption – could change balances in less than a fortnight.
Capital expenditures, or "capex", for S&P 500 companies rose by 11.3% in the first half of 2014 however, that trend is different – almost the opposite - for the world’s largest oil companies. Is this capex reduction due to rising input costs, finding & development costs, returning cash to shareholders, or recognition of sloppy demand? Either way, this could quickly help recalibrate the supply demand balance sheet.
Going forward, the key will be to take notice of new incremental data points over the next few months – especially from China and India. Developed market economies have had a turn at the wheel, but the emerging market economies (EM) remain the essential driving force going forward.