


Take a Look: Fibonacci Analysis May Foreshadow S&P 500 Pullback
What does a set of numbers you may have heard about in high school mathematics have to do with your 401(k). Quite a bit, it turns out, according to so-called technical traders.
While some market participants focus on fundamentals like profits, sales, margin and other factors in making decisions on what stocks to own, others look for trends in key indicators that sometimes foreshadow price moves.
Fibonacci retracement is a popular tool among traders. It works on the premise that occasionally shares will retrace part of a broader trend before shifting course back in the original direction. The Fibonacci component comes in when deciding specifically what resistance or support points to choose. Four points -- that match key Fibonacci ratios -- are chosen between 0% and 100% from an arbitrarily-determined peak and trough.
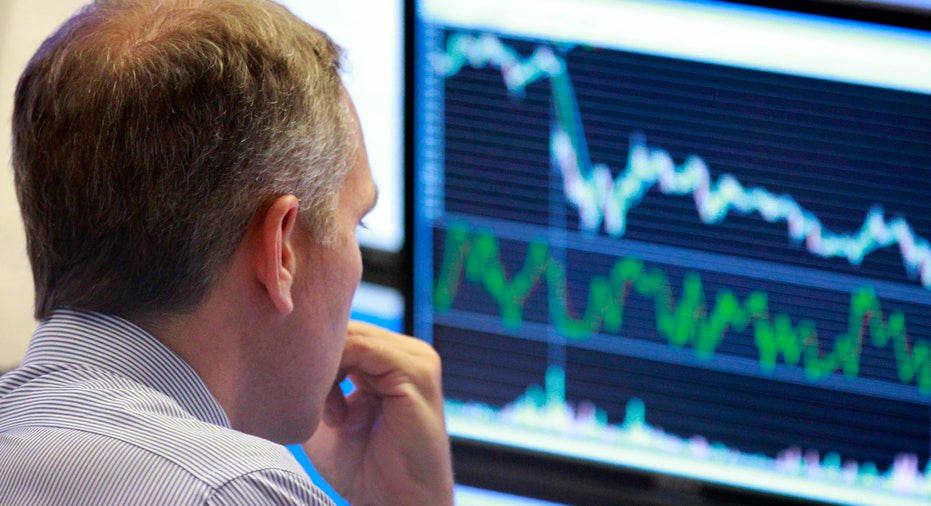
The following chart compiled by FOX Business maps out the S&P 500 from its April peak to early-October lows. The broad index on Monday failed to maintain a 50% retracement level and is now pointed back toward the 38.2% level -- potentially indicating the recent rally may be fading.