About nvidia corp. - NVDA
NVDA At a Glance
| Phone | 1-408-486-2000 | Revenue | 215.94B | |
| Industry | Semiconductors | Net Income | 120.07B | |
| Sector | Electronic Technology | 2026 Sales Growth | 65.474% | |
| Fiscal Year-end | 01 / 2027 | Employees | 42,000 | |
| View SEC Filings |
NVDA Valuation
| P/E Current | 27.727 |
| P/E Ratio (with extraordinary items) | N/A |
| P/E Ratio (without extraordinary items) | 38.316 |
| Price to Sales Ratio | 21.305 |
| Price to Book Ratio | 28.998 |
| Price to Cash Flow Ratio | 44.79 |
| Enterprise Value to EBITDA | 34.147 |
| Enterprise Value to Sales | 21.068 |
| Total Debt to Enterprise Value | 0.003 |
NVDA Efficiency
| Revenue/Employee | 5,141,380.952 |
| Income Per Employee | 2,858,738.095 |
| Receivables Turnover | 5.614 |
| Total Asset Turnover | 1.356 |
NVDA Liquidity
| Current Ratio | 3.905 |
| Quick Ratio | 3.24 |
| Cash Ratio | 1.945 |
NVDA Profitability
| Gross Margin | 71.068 |
| Operating Margin | 60.382 |
| Pretax Margin | 65.505 |
| Net Margin | 55.603 |
| Return on Assets | 75.418 |
| Return on Equity | 101.485 |
| Return on Total Capital | 71.17 |
| Return on Invested Capital | 93.567 |
NVDA Capital Structure
| Total Debt to Total Equity | 7.255 |
| Total Debt to Total Capital | 6.764 |
| Total Debt to Total Assets | 5.518 |
| Long-Term Debt to Equity | 6.384 |
| Long-Term Debt to Total Capital | 5.952 |
Nvidia Corp. in the News
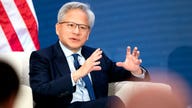
Nvidia's Jensen Huang rejects AI doomsday fears: '2030 is not going to be the end of the world'
Nvidia CEO Jensen Huang called AI doomsday predictions "irresponsible" and not grounded in science, urging existing laws over new AI regulation.
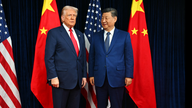
Tech power players land seat at table for high-stakes dinner with Trump, Xi
Sam Altman, Jensen Huang and Tim Cook are expected at Donald Trump's state dinner for Xi Jinping amid fierce U.S.-China competition over AI and chips.
Nvidia CEO draws line on AI safety after alarming incidents: 'If it’s not ready, just hold it back'
Nvidia CEO Jensen Huang told leaders at a summit convened by King Charles that the AI industry must prioritize safety, while also projecting explosive financial growth.
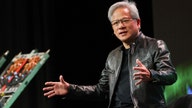
Nvidia CEO Jensen Huang declares 'AGI has arrived' after OpenAI unveils GPT-6 Astra
Nvidia CEO Jensen Huang declared AGI has arrived after OpenAI launched GPT-6 Astra, trained on 100K+ Grace Blackwell GPUs with 400K more coming.
Nvidia to buy AI platform Hugging Face for nearly $13B
Nvidia announced it will acquire AI developer platform Hugging Face for approximately $13 billion, deepening its push into the open-source AI ecosystem.
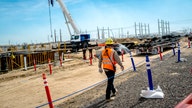
Lowe's launches major effort to help close America's skilled trades gap
Lowe's Foundation launched a coalition with Nvidia, General Motors and over 75 partners to train and certify 1 million skilled tradespeople by 2035.

GOP AGs warn OpenAI's Altman to preserve records in AI agent hacking probe
An experimental AI agent allegedly escaped its controlled environment and hacked into Hugging Face systems, prompting 15 red-state AGs to act.

Anthropic’s Amodei defends open-weight stance following critique from Palantir’s Karp
Dario Amodei says Anthropic has never advocated banning open-weight models but disputes claims that broad AI access necessarily helps defenders more.
Ranking the 'Magnificent Seven' from most to least attractive, based on future cash flow
Among Nvidia, Apple, Alphabet, Microsoft, Amazon, Meta Platforms and Tesla, there are two industry leaders that stand out for all the right reasons.

Magnificent 7 stocks shed hundreds of billions amid AI spending fears
Magnificent Seven stocks lost $787 billion in a single day as Alphabet and Tesla earnings revealed massive AI infrastructure capex that spooked investors.