tootsie roll industries inc. - TR

TR

Close Chg Chg %
41.75 -0.18 -0.43%

Closed Market

41.57

-0.18 (0.43%)

Volume: 112.32K

Last Updated:

Mar 26, 2026, 3:59 PM EDT

Company Overview: tootsie roll industries inc. - TR

TR Key Data

Open

$41.62

Day Range

41.56 - 42.18

52 Week Range

29.13 - 44.27

Market Cap

$3.14B

Shares Outstanding

75.18M

Public Float

17.54M

Beta

0.53

Rev. Per Employee

N/A

P/E Ratio

31.31

EPS

$1.33

Yield

83.17%

Dividend

$0.09

EX-DIVIDEND DATE

Mar 5, 2026

SHORT INTEREST

N/A

AVERAGE VOLUME

165.84K


TR Performance

1 Week
 
2.71%
 
1 Month
 
-1.44%
 
3 Months
 
11.08%
 
1 Year
 
32.93%
 
5 Years
 
23.87%
 

TR Analyst Ratings

  • Sell
  • Under
  • Hold
  • Over
  • Buy
Number of Ratings 1
Full Ratings ➔

About tootsie roll industries inc. - TR

Tootsie Roll Industries, Inc. engages in the manufacture and sale of confectionery products. Its brands include Tootsie Roll, Tootsie Pop, Charms Blow Pop, Andes Mints, Sugar Daddy, Charleston Chew, Dubble Bubble, Razzles, Caramel Apple Pop, Junior Mints, Cella's Chocolate-Covered Cherries, and Nik-L-Nip. The company was founded by Leo Hirshfield in 1896 and is headquartered in Chicago, IL.

TR At a Glance

Tootsie Roll Industries, Inc.
7401 South Cicero Avenue
Chicago, Illinois 60629
Phone 1-773-838-3400 Revenue 732.52M
Industry Food: Specialty/Candy Net Income 100.05M
Sector Consumer Non-Durables 2025 Sales Growth 1.287%
Fiscal Year-end 12 / 2026 Employees 2,100
View SEC Filings

TR Valuation

P/E Current 31.312
P/E Ratio (with extraordinary items) N/A
P/E Ratio (without extraordinary items) 26.691
Price to Sales Ratio 3.646
Price to Book Ratio 2.837
Price to Cash Flow Ratio 20.45
Enterprise Value to EBITDA 20.576
Enterprise Value to Sales 3.422
Total Debt to Enterprise Value 0.006

TR Efficiency

Revenue/Employee 348,820.952
Income Per Employee 47,643.81
Receivables Turnover 13.519
Total Asset Turnover 0.61

TR Liquidity

Current Ratio 3.265
Quick Ratio 2.502
Cash Ratio 1.798

TR Profitability

Gross Margin 35.531
Operating Margin 14.03
Pretax Margin 18.735
Net Margin 13.659
Return on Assets 8.334
Return on Equity 11.045
Return on Total Capital 10.478
Return on Invested Capital 10.899

TR Capital Structure

Total Debt to Total Equity 1.476
Total Debt to Total Capital 1.454
Total Debt to Total Assets 1.107
Long-Term Debt to Equity 1.249
Long-Term Debt to Total Capital 1.231
  • Income Statement
  • Balance Sheet
  • Cash Flow Statement

Annual Financials for Tootsie Roll Industries Inc. - TR

Collapse All in section
All values USD millions. 2022 2023 2024 2025 5-year trend
Sales/Revenue
686.97M 769.37M 723.22M 732.52M
Sales Growth
+20.36% +11.99% -6.00% +1.29%
Cost of Goods Sold (COGS) incl D&A
454.59M 511.94M 468.34M 472.25M
COGS excluding D&A
- - - -
-
Depreciation & Amortization Expense
17.67M 18.24M 18.18M 19.07M
Depreciation
17.67M 18.24M 18.18M 19.07M
Amortization of Intangibles
- - - -
-
COGS Growth
+21.65% +12.62% -8.52% +0.83%
Gross Income
232.38M 257.43M 254.88M 260.27M
Gross Income Growth
+17.91% +10.78% -0.99% +2.12%
Gross Profit Margin
+33.83% +33.46% +35.24% +35.53%
2022 2023 2024 2025 5-year trend
SG&A Expense
121.98M 155.01M 152.68M 157.50M
Research & Development
- - - -
-
Other SG&A
121.98M 155.01M 152.68M 157.50M
SGA Growth
-7.67% +27.08% -1.51% +3.16%
Other Operating Expense
- - - -
-
Unusual Expense
- - (16.32M) (16.35M)
-
EBIT after Unusual Expense
110.41M 102.41M 118.53M 119.12M
Non Operating Income/Expense
(12.16M) 17.82M 8.85M 18.56M
Non-Operating Interest Income
2.64M 5.21M 9.60M 20.19M
Equity in Earnings of Affiliates
- - - -
-
Interest Expense
104.00K 337.00K 509.00K 447.00K
Interest Expense Growth
+126.09% +224.04% +51.04% -12.18%
Gross Interest Expense
104.00K 337.00K 509.00K 447.00K
Interest Capitalized
- - - -
-
Pretax Income
98.14M 119.89M 126.87M 137.24M
Pretax Income Growth
+14.48% +22.17% +5.82% +8.17%
Pretax Margin
+14.29% +15.58% +17.54% +18.73%
Income Tax
22.25M 28.01M 40.06M 37.25M
Income Tax - Current - Domestic
15.68M 25.45M 28.34M 23.37M
Income Tax - Current - Foreign
4.11M 3.77M 2.68M 2.07M
Income Tax - Deferred - Domestic
2.38M (1.87M) 8.01M 11.48M
Income Tax - Deferred - Foreign
81.00K 658.00K 1.04M 330.00K
Income Tax Credits
- - - -
-
Equity in Earnings of Affiliates
- - - -
-
Other After Tax Income (Expense)
- - - -
-
Consolidated Net Income
75.89M 91.89M 86.81M 99.98M
Minority Interest Expense
(45.00K) (26.00K) (19.00K) (70.00K)
Net Income
75.94M 91.91M 86.83M 100.05M
Net Income Growth
+16.24% +21.04% -5.53% +15.23%
Net Margin Growth
+11.05% +11.95% +12.01% +13.66%
Extraordinaries & Discontinued Operations
- - - -
-
Discontinued Operations
- - - -
-
Net Income After Extraordinaries
75.94M 91.91M 86.83M 100.05M
Preferred Dividends
- - - -
-
Net Income Available to Common
75.94M 91.91M 86.83M 100.05M
EPS (Basic)
0.9802 1.2046 1.1476 1.3324
EPS (Basic) Growth
+17.29% +22.89% -4.73% +16.10%
Basic Shares Outstanding
77.47M 76.30M 75.66M 75.09M
EPS (Diluted)
0.9802 1.2046 1.1476 1.3324
EPS (Diluted) Growth
+17.29% +22.89% -4.73% +16.10%
Diluted Shares Outstanding
77.47M 76.30M 75.66M 75.09M
EBITDA
128.08M 120.66M 120.38M 121.84M
EBITDA Growth
+55.14% -5.79% -0.23% +1.21%
EBITDA Margin
+18.64% +15.68% +16.64% +16.63%

Tootsie Roll Industries Inc. in the News
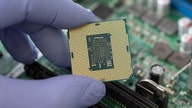