seven & i holdings co. ltd. - SVNDF

SVNDF

Close Chg Chg %
14.00 -0.95 -6.79%

Closed Market

13.05

-0.95 (6.79%)

Volume: 1.09K

Last Updated:

Mar 26, 2026, 1:06 PM EDT

Company Overview: seven & i holdings co. ltd. - SVNDF

SVNDF Key Data

Open

$13.05

Day Range

13.05 - 13.05

52 Week Range

11.24 - 16.04

Market Cap

$33.33B

Shares Outstanding

2.38B

Public Float

1.69B

Beta

0.53

Rev. Per Employee

N/A

P/E Ratio

17.30

EPS

$0.81

Yield

236.54%

Dividend

$0.16

EX-DIVIDEND DATE

Feb 26, 2026

SHORT INTEREST

N/A

AVERAGE VOLUME

5.07K


SVNDF Performance

1 Week
 
6.29%
 
1 Month
 
-12.12%
 
3 Months
 
-10.65%
 
1 Year
 
-20.18%
 
5 Years
 
N/A
 

SVNDF Analyst Ratings

  • Sell
  • Under
  • Hold
  • Over
  • Buy
Number of Ratings
Full Ratings ➔

About seven & i holdings co. ltd. - SVNDF

Seven & i Holdings Co., Ltd. engages in the planning, management, and operation of its group companies. It operates through the following business segments: Domestic Convenience Store, Overseas Convenience Store, Supermarket Store, Financial Services and Others. The Domestic Convenience Store segment directly managed and franchised stores under the name of 7-Eleven in Japan. The Overseas Convenience Store segment Is involved in managing and franchising stores under the name of 7-Eleven in oversea. The Supermarket Store segment manages supermarkets and specialty shops. The Financial Services segment deals with bank, credit card, lease, and other businesses. The company was founded in September 2005 and is headquartered in Tokyo, Japan.

SVNDF At a Glance

Seven & i Holdings Co., Ltd.
8-8 Nibancho
Tokyo, Tokyo 102-8452
Phone 81-3-6238-3000 Revenue 78.51B
Industry Food Retail Net Income 1.13B
Sector Retail Trade Employees 62,012
Fiscal Year-end 02 / 2026
View SEC Filings

SVNDF Valuation

P/E Current 17.303
P/E Ratio (with extraordinary items) N/A
P/E Ratio (without extraordinary items) 32.564
Price to Sales Ratio 0.471
Price to Book Ratio 1.38
Price to Cash Flow Ratio 6.78
Enterprise Value to EBITDA 8.727
Enterprise Value to Sales 0.726
Total Debt to Enterprise Value 0.489

SVNDF Efficiency

Revenue/Employee 1,266,048.856
Income Per Employee 18,300.919
Receivables Turnover 21.607
Total Asset Turnover 1.073

SVNDF Liquidity

Current Ratio 0.851
Quick Ratio 0.756
Cash Ratio 0.413

SVNDF Profitability

Gross Margin 25.599
Operating Margin 3.516
Pretax Margin 2.25
Net Margin 1.446
Return on Assets 1.551
Return on Equity 4.401
Return on Total Capital 2.078
Return on Invested Capital 2.417

SVNDF Capital Structure

Total Debt to Total Equity 104.181
Total Debt to Total Capital 51.024
Total Debt to Total Assets 36.876
Long-Term Debt to Equity 80.529
Long-Term Debt to Total Capital 39.44
  • Income Statement
  • Balance Sheet
  • Cash Flow Statement

Annual Financials for Seven & I Holdings Co. Ltd. - SVNDF

Collapse All in section
All values USD millions. 2022 2023 2024 2025 5-year trend
Sales/Revenue
78.47B 88.08B 80.09B 78.51B
Sales Growth
+44.25% +12.24% -9.07% -1.98%
Cost of Goods Sold (COGS) incl D&A
56.47B 66.12B 58.99B 58.41B
COGS excluding D&A
- - - -
-
Depreciation & Amortization Expense
3.26B 3.64B 3.64B 3.77B
Depreciation
- - - -
-
Amortization of Intangibles
- - - -
-
COGS Growth
+61.76% +17.09% -10.79% -0.98%
Gross Income
22.00B 21.95B 21.10B 20.10B
Gross Income Growth
+12.88% -0.22% -3.87% -4.77%
Gross Profit Margin
+28.04% +24.93% +26.35% +25.60%
2022 2023 2024 2025 5-year trend
SG&A Expense
18.53B 18.18B 17.37B 17.34B
Research & Development
- - - -
-
Other SG&A
18.53B 18.18B 17.37B 17.34B
SGA Growth
+15.52% -1.88% -4.42% -0.21%
Other Operating Expense
- - - -
-
Unusual Expense
370.01M 495.01M 654.55M 832.66M
EBIT after Unusual Expense
3.11B 3.28B 3.08B 1.93B
Non Operating Income/Expense
(46.59M) (7.41M) (840.38M) 240.79M
Non-Operating Interest Income
28.88M 45.11M 85.08M 68.01M
Equity in Earnings of Affiliates
23.70M 18.69M 25.91M (2.95M)
Interest Expense
263.22M 271.32M 301.04M 402.51M
Interest Expense Growth
+163.62% +3.08% +10.96% +33.70%
Gross Interest Expense
263.22M 271.32M 301.04M 402.51M
Interest Capitalized
- - - -
-
Pretax Income
2.80B 3.00B 1.93B 1.77B
Pretax Income Growth
+14.57% +7.38% -35.61% -8.67%
Pretax Margin
+3.56% +3.41% +2.41% +2.25%
Income Tax
794.74M 824.68M 291.86M 566.11M
Income Tax - Current - Domestic
599.88M 536.02M 440.66M 525.71M
Income Tax - Current - Foreign
- - - -
-
Income Tax - Deferred - Domestic
194.86M 288.66M (148.80M) 40.39M
Income Tax - Deferred - Foreign
- - - -
-
Income Tax Credits
- - - -
-
Equity in Earnings of Affiliates
23.70M 18.69M 25.91M (2.95M)
Other After Tax Income (Expense)
- - - -
-
Consolidated Net Income
2.00B 2.18B 1.64B 1.20B
Minority Interest Expense
111.80M 83.47M 73.87M 65.26M
Net Income
1.89B 2.10B 1.57B 1.13B
Net Income Growth
+11.78% +10.84% -25.15% -27.63%
Net Margin Growth
+2.41% +2.38% +1.96% +1.45%
Extraordinaries & Discontinued Operations
- - - -
-
Discontinued Operations
- - - -
-
Net Income After Extraordinaries
1.89B 2.10B 1.57B 1.13B
Preferred Dividends
- - - -
-
Net Income Available to Common
1.89B 2.10B 1.57B 1.13B
EPS (Basic)
0.7136 0.7908 0.5926 0.4369
EPS (Basic) Growth
+11.76% +10.82% -25.06% -26.27%
Basic Shares Outstanding
2.65B 2.65B 2.65B 2.60B
EPS (Diluted)
0.7135 0.7908 0.5926 0.4368
EPS (Diluted) Growth
+11.76% +10.83% -25.06% -26.29%
Diluted Shares Outstanding
2.65B 2.65B 2.65B 2.60B
EBITDA
6.74B 7.42B 7.37B 6.53B
EBITDA Growth
+13.97% +10.12% -0.76% -11.34%
EBITDA Margin
+8.59% +8.43% +9.20% +8.32%

Seven & I Holdings Co. Ltd. in the News
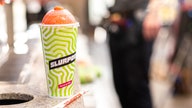