oshkosh corp. - OSK

OSK

Close Chg Chg %
128.15 2.74 2.14%

Closed Market

130.89

+2.74 (2.14%)

Volume: 439.82K

Last Updated:

Dec 4, 2025, 3:59 PM EDT

Company Overview: oshkosh corp. - OSK

OSK Key Data

Open

$127.82

Day Range

127.64 - 130.93

52 Week Range

76.82 - 144.03

Market Cap

$8.11B

Shares Outstanding

63.25M

Public Float

62.80M

Beta

1.41

Rev. Per Employee

N/A

P/E Ratio

12.16

EPS

$10.31

Yield

163.51%

Dividend

$0.51

EX-DIVIDEND DATE

Nov 17, 2025

SHORT INTEREST

N/A

AVERAGE VOLUME

632.69K


OSK Performance

1 Week
 
-0.02%
 
1 Month
 
5.51%
 
3 Months
 
-8.18%
 
1 Year
 
20.18%
 
5 Years
 
51.46%
 

OSK Analyst Ratings

  • Sell
  • Under
  • Hold
  • Over
  • Buy
Number of Ratings 16
Full Ratings ➔

About oshkosh corp. - OSK

Oshkosh Corp. is an industrial company, which engages in the design, development, and manufacture of purpose-built vehicles and equipment. It operates through the following segments: Access, Defense, and Vocational. The Access segment designs and manufactures access and material handling equipment. The Defense segment is involved in design and manufacture, and sustains vehicles and mobility systems. The Vocational segment includes the Pierce, Maxi-Metal, McNeilus, AeroTech, IMT, Frontline Communications, and Oshkosh S-Series businesses. The company was founded in 1917 and is headquartered in Oshkosh, WI.

OSK At a Glance

Oshkosh Corp.
1917 Four Wheel Drive
Oshkosh, Wisconsin 54902-2400
Phone 1-920-502-3400 Revenue 10.73B
Industry Motor Vehicles Net Income 681.40M
Sector Consumer Durables 2024 Sales Growth 11.213%
Fiscal Year-end 12 / 2025 Employees 18,500
View SEC Filings

OSK Valuation

P/E Current 12.409
P/E Ratio (with extraordinary items) N/A
P/E Ratio (without extraordinary items) 9.185
Price to Sales Ratio 0.583
Price to Book Ratio 1.479
Price to Cash Flow Ratio 11.38
Enterprise Value to EBITDA 5.725
Enterprise Value to Sales 0.681
Total Debt to Enterprise Value 0.171

OSK Efficiency

Revenue/Employee 580,010.811
Income Per Employee 36,832.432
Receivables Turnover 5.524
Total Asset Turnover 1.157

OSK Liquidity

Current Ratio 1.516
Quick Ratio 0.757
Cash Ratio 0.069

OSK Profitability

Gross Margin 19.415
Operating Margin 10.026
Pretax Margin 8.416
Net Margin 6.35
Return on Assets 7.346
Return on Equity 17.344
Return on Total Capital 12.612
Return on Invested Capital 14.366

OSK Capital Structure

Total Debt to Total Equity 30.122
Total Debt to Total Capital 23.149
Total Debt to Total Assets 13.273
Long-Term Debt to Equity 19.491
Long-Term Debt to Total Capital 14.979
  • Income Statement
  • Balance Sheet
  • Cash Flow Statement

Annual Financials for Oshkosh Corp. - OSK

Collapse All in section
All values USD millions. 2021 2022 2023 2024 5-year trend
Sales/Revenue
7.74B 8.28B 9.65B 10.73B
Sales Growth
+12.84% +7.04% +16.50% +11.21%
Cost of Goods Sold (COGS) incl D&A
6.41B 7.12B 7.87B 8.65B
COGS excluding D&A
- - - -
-
Depreciation & Amortization Expense
93.50M 96.30M 144.90M 200.10M
Depreciation
83.90M 84.70M 103.20M 145.40M
Amortization of Intangibles
9.60M 11.60M 41.70M 54.70M
COGS Growth
+13.86% +11.08% +10.52% +9.82%
Gross Income
1.32B 1.16B 1.77B 2.08B
Gross Income Growth
+8.17% -12.52% +53.27% +17.42%
Gross Profit Margin
+17.10% +13.98% +18.39% +19.42%
2021 2022 2023 2024 5-year trend
SG&A Expense
771.50M 776.20M 930.50M 1.01B
Research & Development
103.10M 113.40M 133.60M 169.10M
Other SG&A
668.40M 662.80M 796.90M 838.40M
SGA Growth
+8.05% +0.61% +19.88% +8.28%
Other Operating Expense
- - - -
-
Unusual Expense
6.90M 8.20M 3.50M 64.20M
EBIT after Unusual Expense
544.90M 373.20M 840.30M 1.01B
Non Operating Income/Expense
1.20M (44.20M) 25.90M 10.90M
Non-Operating Interest Income
3.50M 9.50M 14.80M 7.60M
Equity in Earnings of Affiliates
- - - -
-
Interest Expense
48.20M 53.40M 68.60M 119.50M
Interest Expense Growth
-5.12% +10.79% +28.46% +74.20%
Gross Interest Expense
48.20M 53.40M 68.60M 119.50M
Interest Capitalized
- - - -
-
Pretax Income
497.90M 275.60M 797.60M 903.00M
Pretax Income Growth
+13.39% -44.65% +189.40% +13.21%
Pretax Margin
+6.44% +3.33% +8.27% +8.42%
Income Tax
25.20M 97.50M 190.00M 210.00M
Income Tax - Current - Domestic
(71.90M) 109.00M 320.50M 205.80M
Income Tax - Current - Foreign
8.50M 42.00M 29.90M 22.10M
Income Tax - Deferred - Domestic
94.20M (52.10M) (152.40M) (21.60M)
Income Tax - Deferred - Foreign
(5.60M) (1.40M) (8.00M) 3.70M
Income Tax Credits
- - - -
-
Equity in Earnings of Affiliates
- - - -
-
Other After Tax Income (Expense)
- - - -
-
Consolidated Net Income
472.70M 173.90M 598.00M 681.40M
Minority Interest Expense
- - - -
-
Net Income
472.70M 173.90M 598.00M 681.40M
Net Income Growth
+45.67% -63.21% +243.88% +13.95%
Net Margin Growth
+6.11% +2.10% +6.20% +6.35%
Extraordinaries & Discontinued Operations
- - - -
-
Discontinued Operations
- - - -
-
Net Income After Extraordinaries
472.70M 173.90M 598.00M 681.40M
Preferred Dividends
- - - -
-
Net Income Available to Common
472.70M 173.90M 598.00M 681.40M
EPS (Basic)
6.9025 2.6469 9.1462 10.4096
EPS (Basic) Growth
+44.96% -61.65% +245.54% +13.81%
Basic Shares Outstanding
68.48M 65.70M 65.38M 65.46M
EPS (Diluted)
6.8301 2.6295 9.0793 10.351
EPS (Diluted) Growth
+44.79% -61.50% +245.29% +14.01%
Diluted Shares Outstanding
69.21M 66.13M 65.86M 65.83M
EBITDA
645.30M 477.70M 988.70M 1.28B
EBITDA Growth
+7.09% -25.97% +106.97% +29.05%
EBITDA Margin
+8.34% +5.77% +10.25% +11.89%

Snapshot

Average Recommendation OVERWEIGHT Average Target Price 151.538
Number of Ratings 16 Current Quarters Estimate 2.304
FY Report Date 12 / 2025 Current Year's Estimate 10.842
Last Quarter’s Earnings 3.20 Median PE on CY Estimate N/A
Year Ago Earnings 11.74 Next Fiscal Year Estimate 12.427
Median PE on Next FY Estimate N/A

Earnings Per Share

This Quarter Next Quarter This Fiscal Next Fiscal
# of Estimates 14 12 15 15
Mean Estimate 2.30 2.39 10.84 12.43
High Estimates 2.45 2.79 11.06 13.30
Low Estimate 2.13 2.10 10.65 11.30
Coefficient of Variance 4.35 9.38 1.04 4.99

Analysts Recommendations

Current 1 Month Ago 3 Months Ago
BUY 8 8 7
OVERWEIGHT 4 4 2
HOLD 4 4 5
UNDERWEIGHT 0 0 1
SELL 0 0 0
MEAN Overweight Overweight Overweight

Insider Actions for Oshkosh Corp. - OSK

Date Name Shares Transaction Value
Nov 25, 2025 Ignacio A. Cortina EVP, CL&AO & Secretary 45,506 Open market or private sale of non-derivative or derivative security Non-derivative transaction at $124.41 per share 5,661,401.46
Aug 21, 2025 Bryan K. Brandt SVP & Chief Marketing Officer 10,459 Open market or private sale of non-derivative or derivative security Non-derivative transaction at $140.37 per share 1,468,129.83
Aug 8, 2025 James Chris Freeders SVP, Finance and Controller 9,228 Open market or private sale of non-derivative or derivative security Non-derivative transaction at $136.59 per share 1,260,452.52
Aug 8, 2025 James Chris Freeders SVP, Finance and Controller N/A Exercise or conversion of derivative security exempted pursuant to Rule 16b-3 0.00
Aug 8, 2025 James Chris Freeders SVP, Finance and Controller 9,228 Open market or private sale of non-derivative or derivative security Non-derivative transaction at $136.68 per share 1,261,283.04
Aug 8, 2025 James Chris Freeders SVP, Finance and Controller 11,478 Exercise or conversion of derivative security exempted pursuant to Rule 16b-3 Non-derivative transaction at $86.59 per share 993,880.02
Aug 8, 2025 James Chris Freeders SVP, Finance and Controller 9,228 Open market or private sale of non-derivative or derivative security Non-derivative transaction at $136.72 per share 1,261,652.16
Aug 8, 2025 James Chris Freeders SVP, Finance and Controller 14,803 Exercise or conversion of derivative security exempted pursuant to Rule 16b-3 Non-derivative transaction at $66.09 per share 978,330.27
Aug 8, 2025 James Chris Freeders SVP, Finance and Controller 13,528 Exercise or conversion of derivative security exempted pursuant to Rule 16b-3 Non-derivative transaction at $90.28 per share 1,221,307.84
Aug 8, 2025 James Chris Freeders SVP, Finance and Controller N/A Exercise or conversion of derivative security exempted pursuant to Rule 16b-3 0.00
Jul 16, 2025 Stephen Craig Nordlund Exec. VP & Pres., Transport 12,452 Grant, award or other acq pursuant to Rule 16b-3(d) 0.00
May 9, 2025 Tyrone Michael Jordan Director 10,814 Grant, award or other acq pursuant to Rule 16b-3(d) 0.00
May 9, 2025 Annette K. Clayton Director 3,412 Grant, award or other acq pursuant to Rule 16b-3(d) 0.00
May 9, 2025 William J. Burns Director 3,210 Grant, award or other acq pursuant to Rule 16b-3(d) 0.00
May 9, 2025 Keith J. Allman Director 22,840 Grant, award or other acq pursuant to Rule 16b-3(d) 0.00
May 9, 2025 Sandra E. Rowland Director 12,709 Grant, award or other acq pursuant to Rule 16b-3(d) Non-derivative transaction at $88.26 per share 1,121,696.34
May 9, 2025 Kimberley Metcalf-Kupres Director 18,759 Grant, award or other acq pursuant to Rule 16b-3(d) 0.00
May 9, 2025 Douglas L. Davis Director 7,673 Grant, award or other acq pursuant to Rule 16b-3(d) 0.00
May 9, 2025 Duncan John Palmer Director 38,451 Grant, award or other acq pursuant to Rule 16b-3(d) 0.00

Oshkosh Corp. in the News
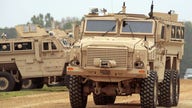