mp materials corp - MP

MP

Close Chg Chg %
53.30 0.46 0.86%

Closed Market

53.76

+0.46 (0.86%)

Volume: 3.86M

Last Updated:

Mar 25, 2026, 3:59 PM EDT

Company Overview: mp materials corp - MP

MP Key Data

Open

$54.91

Day Range

52.80 - 55.69

52 Week Range

18.65 - 100.25

Market Cap

$9.47B

Shares Outstanding

177.67M

Public Float

143.36M

Beta

1.56

Rev. Per Employee

N/A

P/E Ratio

N/A

EPS

-$0.51

Yield

0.00%

Dividend

N/A

EX-DIVIDEND DATE

SHORT INTEREST

N/A

AVERAGE VOLUME

5.75M


MP Performance

1 Week
 
5.32%
 
1 Month
 
-9.48%
 
3 Months
 
-0.17%
 
1 Year
 
105.20%
 
5 Years
 
52.26%
 

MP Analyst Ratings

  • Sell
  • Under
  • Hold
  • Over
  • Buy
Number of Ratings 15
Full Ratings ➔

About mp materials corp - MP

MP Materials Corp. engages in the production and marketing of rare earth specialty materials. It operates through the Materials and Magnetics segments. The Materials segment focuses on the operation of Mountain Pass, which produces refined rare earth oxides and related products, as well as rare earth concentrate products. The Magnetics segment is involved in the operation of Independence Facility, where the company began production of magnetic precursor products. The company was founded by James Henry Litinsky and Michael Rosenthal in 2017 and is headquartered in Las Vegas, NV.

MP At a Glance

MP Materials Corp.
1700 South Pavilion Center Drive
Las Vegas, Nevada 89135
Phone 1-702-844-6111 Revenue 275.46M
Industry Other Metals/Minerals Net Income -85,874,000.00
Sector Non-Energy Minerals 2025 Sales Growth 35.124%
Fiscal Year-end 12 / 2026 Employees 998
View SEC Filings

MP Valuation

P/E Current N/A
P/E Ratio (with extraordinary items) N/A
P/E Ratio (without extraordinary items) N/A
Price to Sales Ratio 31.202
Price to Book Ratio 4.528
Price to Cash Flow Ratio N/A
Enterprise Value to EBITDA -256.496
Enterprise Value to Sales 29.812
Total Debt to Enterprise Value 0.126

MP Efficiency

Revenue/Employee 276,009.018
Income Per Employee -86,046.092
Receivables Turnover 1.878
Total Asset Turnover 0.085

MP Liquidity

Current Ratio 7.242
Quick Ratio 6.669
Cash Ratio 6.123

MP Profitability

Gross Margin -2.396
Operating Margin -44.571
Pretax Margin -42.756
Net Margin -31.175
Return on Assets -2.659
Return on Equity -4.982
Return on Total Capital -2.506
Return on Invested Capital -3.227

MP Capital Structure

Total Debt to Total Equity 43.248
Total Debt to Total Capital 30.191
Total Debt to Total Assets 25.803
Long-Term Debt to Equity 48.522
Long-Term Debt to Total Capital 28.016
  • Income Statement
  • Balance Sheet
  • Cash Flow Statement

Annual Financials for Mp Materials Corp - MP

Collapse All in section
All values USD millions. 2022 2023 2024 2025 5-year trend
Sales/Revenue
527.51M 253.44M 203.85M 275.46M
Sales Growth
+58.91% -51.95% -19.57% +35.12%
Cost of Goods Sold (COGS) incl D&A
112.05M 148.42M 270.64M 282.06M
COGS excluding D&A
- - - -
-
Depreciation & Amortization Expense
19.83M 56.62M 78.99M 90.76M
Depreciation
19.83M 56.22M 77.79M 89.56M
Amortization of Intangibles
- 400.00K 1.20M 1.20M
COGS Growth
+8.78% +32.46% +82.35% +4.22%
Gross Income
415.46M 105.02M (66.79M) (6.60M)
Gross Income Growth
+81.47% -74.72% -163.59% +90.12%
Gross Profit Margin
+78.76% +41.44% -32.76% -2.40%
2022 2023 2024 2025 5-year trend
SG&A Expense
87.66M 82.74M 84.24M 116.17M
Research & Development
11.82M 3.50M 940.00K 4.11M
Other SG&A
75.84M 79.25M 83.30M 112.07M
SGA Growth
+45.56% -5.61% +1.81% +37.91%
Other Operating Expense
- - - -
-
Unusual Expense
- 11.44M (45.14M) 20.10M
EBIT after Unusual Expense
327.80M 10.85M (105.88M) (142.87M)
Non Operating Income/Expense
19.14M 27.48M 35.55M 56.58M
Non-Operating Interest Income
19.83M 55.64M 47.11M 52.02M
Equity in Earnings of Affiliates
- - - -
-
Interest Expense
5.79M 5.25M 23.01M 31.48M
Interest Expense Growth
-35.02% -9.19% +337.95% +36.81%
Gross Interest Expense
6.15M 5.58M 23.40M 37.66M
Interest Capitalized
360.00K 326.00K 391.00K 6.18M
Pretax Income
341.15M 33.08M (93.35M) (117.77M)
Pretax Income Growth
+112.96% -90.30% -382.23% -26.17%
Pretax Margin
+64.67% +13.05% -45.79% -42.76%
Income Tax
52.15M 8.77M (27.92M) (31.90M)
Income Tax - Current - Domestic
34.36M 313.00K (148.00K) (1.51M)
Income Tax - Current - Foreign
- - - -
-
Income Tax - Deferred - Domestic
17.79M 8.46M (27.77M) (30.39M)
Income Tax - Deferred - Foreign
- - - -
-
Income Tax Credits
- - - -
-
Equity in Earnings of Affiliates
- - - -
-
Other After Tax Income (Expense)
- - - -
-
Consolidated Net Income
289.00M 24.31M (65.42M) (85.87M)
Minority Interest Expense
- - - -
-
Net Income
289.00M 24.31M (65.42M) (85.87M)
Net Income Growth
+114.02% -91.59% -369.16% -31.26%
Net Margin Growth
+54.79% +9.59% -32.09% -31.18%
Extraordinaries & Discontinued Operations
- - - -
-
Discontinued Operations
- - - -
-
Net Income After Extraordinaries
289.00M 24.31M (65.42M) (85.87M)
Preferred Dividends
- - - -
-
Net Income Available to Common
289.00M 24.31M (65.42M) (85.87M)
EPS (Basic)
1.6372 0.1372 -0.3921 -0.5048
EPS (Basic) Growth
+110.33% -91.62% -385.79% -28.74%
Basic Shares Outstanding
176.52M 177.18M 166.84M 170.13M
EPS (Diluted)
1.5169 0.1364 -0.5716 -0.5048
EPS (Diluted) Growth
+108.08% -91.01% -519.06% +11.69%
Diluted Shares Outstanding
193.45M 178.15M 169.88M 170.13M
EBITDA
347.63M 78.90M (72.04M) (32.02M)
EBITDA Growth
+79.50% -77.30% -191.31% +55.56%
EBITDA Margin
+65.90% +31.13% -35.34% -11.62%

Snapshot

Average Recommendation BUY Average Target Price 77.667
Number of Ratings 15 Current Quarters Estimate -0.00
FY Report Date 03 / 2026 Current Year's Estimate 0.296
Last Quarter’s Earnings 0.09 Median PE on CY Estimate N/A
Year Ago Earnings -0.24 Next Fiscal Year Estimate 1.116
Median PE on Next FY Estimate N/A

Earnings Per Share

This Quarter Next Quarter This Fiscal Next Fiscal
# of Estimates 10 10 13 12
Mean Estimate -0.00 0.04 0.30 1.12
High Estimates 0.08 0.13 1.07 1.73
Low Estimate -0.07 -0.04 -0.03 0.58
Coefficient of Variance -13,664.99 109.09 100.27 29.76

Analysts Recommendations

Current 1 Month Ago 3 Months Ago
BUY 14 13 14
OVERWEIGHT 1 1 2
HOLD 0 0 0
UNDERWEIGHT 0 0 0
SELL 0 0 0
MEAN Buy Buy Buy

Insider Actions for Mp Materials Corp - MP

Date Name Shares Transaction Value
Mar 28, 2025 James Henry Litinsky Chairman and CEO; Director 13,860,775 Open market or private sale of non-derivative or derivative security Non-derivative transaction at $27.03 per share 374,656,748.25
Mar 28, 2025 James Henry Litinsky Chairman and CEO; Director 13,842,256 Open market or private sale of non-derivative or derivative security Non-derivative transaction at $27 per share 373,740,912.00

Mp Materials Corp in the News
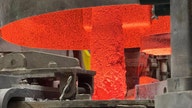