About jde peet's nv - JDEPF
JDE Peet's NV is a holding company, which engages in the production and distribution of coffee and tea products. It operates through the following segments: Europe, Latin America, Russia, Middle East, and Africa (LARMEA), Peet's, and Asia-Pacific (APAC). The Europe segment includes France, Switzerland, Eastern European markets, and the brands L'OR, Jacobs, and Senseo. The LARMEA segment focuses on Russia and Brazil. The Peet's segment offers the same store sales and ticket. The APAC segment consists of Malaysia, Thailand, and New Zealand, and from brands Campos, and OldTown. The company was founded on November 21, 2018 and is headquartered in Amsterdam, the Netherlands.
JDEPF At a Glance
JDE Peet's NV
Oosterdoksstraat 80
Amsterdam, Noord-Holland 1011 DK
| Phone | 31-20-558-17-53 | Revenue | 11.20B | |
| Industry | Food: Specialty/Candy | Net Income | 898.35M | |
| Sector | Consumer Non-Durables | 2025 Sales Growth | 17.133% | |
| Fiscal Year-end | 12 / 2026 | Employees | 21,143 | |
| View SEC Filings |
JDEPF Valuation
| P/E Current | 20.104 |
| P/E Ratio (with extraordinary items) | N/A |
| P/E Ratio (without extraordinary items) | 20.222 |
| Price to Sales Ratio | 1.653 |
| Price to Book Ratio | 1.379 |
| Price to Cash Flow Ratio | 11.94 |
| Enterprise Value to EBITDA | 15.959 |
| Enterprise Value to Sales | 2.045 |
| Total Debt to Enterprise Value | 0.282 |
JDEPF Efficiency
| Revenue/Employee | 529,566.374 |
| Income Per Employee | 42,489.148 |
| Receivables Turnover | 11.669 |
| Total Asset Turnover | 0.418 |
JDEPF Liquidity
| Current Ratio | 0.731 |
| Quick Ratio | 0.439 |
| Cash Ratio | 0.267 |
JDEPF Profitability
| Gross Margin | 29.322 |
| Operating Margin | 8.90 |
| Pretax Margin | 9.858 |
| Net Margin | 8.023 |
| Return on Assets | 3.35 |
| Return on Equity | 7.296 |
| Return on Total Capital | 4.582 |
| Return on Invested Capital | 5.088 |
JDEPF Capital Structure
| Total Debt to Total Equity | 49.138 |
| Total Debt to Total Capital | 32.948 |
| Total Debt to Total Assets | 22.482 |
| Long-Term Debt to Equity | 41.883 |
| Long-Term Debt to Total Capital | 28.084 |
Jde Peet'S Nv in the News
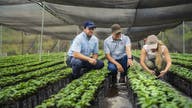
Peet's Coffee becomes sustainable brand with '100% responsibly sourced coffee'
Peet's Coffee is now a sustainable coffee chain after six years of undergoing thorough farm and supply chain audits from a coffee industry nonprofit.
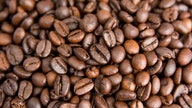
COVID-19 lockdowns in Asia deepen commodity supply-chain pain
The recent surge in COVID-19 cases in Southeast Asia has throttled ports and locked down plantations and processors, sparking extended disruptions of raw materials such as palm oil, coffee and tin.