About the hershey co. - HSY
HSY At a Glance
| Phone | 1-717-534-4200 | Revenue | 11.69B | |
| Industry | Food: Specialty/Candy | Net Income | 883.26M | |
| Sector | Consumer Non-Durables | 2025 Sales Growth | 4.377% | |
| Fiscal Year-end | 12 / 2026 | Employees | 19,595 | |
| View SEC Filings |
HSY Valuation
| P/E Current | 31.793 |
| P/E Ratio (with extraordinary items) | N/A |
| P/E Ratio (without extraordinary items) | 41.897 |
| Price to Sales Ratio | 3.165 |
| Price to Book Ratio | 7.961 |
| Price to Cash Flow Ratio | 16.25 |
| Enterprise Value to EBITDA | 21.215 |
| Enterprise Value to Sales | 3.577 |
| Total Debt to Enterprise Value | 0.137 |
HSY Efficiency
| Revenue/Employee | 596,712.223 |
| Income Per Employee | 45,075.734 |
| Receivables Turnover | 16.027 |
| Total Asset Turnover | 0.876 |
HSY Liquidity
| Current Ratio | 1.192 |
| Quick Ratio | 0.717 |
| Cash Ratio | 0.307 |
HSY Profitability
| Gross Margin | 33.387 |
| Operating Margin | 12.553 |
| Pretax Margin | 10.384 |
| Net Margin | 7.554 |
| Return on Assets | 6.619 |
| Return on Equity | 18.89 |
| Return on Total Capital | 8.513 |
| Return on Invested Capital | 9.917 |
HSY Capital Structure
| Total Debt to Total Equity | 123.763 |
| Total Debt to Total Capital | 55.31 |
| Total Debt to Total Assets | 41.762 |
| Long-Term Debt to Equity | 107.125 |
| Long-Term Debt to Total Capital | 47.874 |
The Hershey Co. in the News

Hershey's launches limited-edition Christian Pulisic chocolate bars honoring their hometown World Cup star
Christian Pulisic partnered with Hershey's for limited-edition chocolate bars honoring the U.S. soccer star ahead of the 2026 FIFA World Cup on home soil.

Hershey to return to classic Reese’s recipe after founder’s grandson criticizes brand
Hershey plans to phase out compound coatings in select Reese's products, transitioning to traditional chocolate by 2027, affecting less than 3% of Reese's items.
Grandson of Reese’s inventor blasts Hershey over alleged recipe changes: 'I threw it in the garbage'
Reese's founder's grandson accuses Hershey of quietly changing beloved candy recipes, replacing milk chocolate and peanut butter with cheaper substitutes.

US retailers lowering prices on Hershey's candy ahead of Halloween: report
U.S. retailers are offering discounts on Hershey candy ahead of Halloween as the candy maker hiked prices over tariffs and cocoa inflation, a report said.

'Made in America' loan cap doubled under new Trump-backed manufacturing push
Amid tariffs and President Donald Trump's agenda to increase U.S. manufacturing, sponsors say the Made in America Manufacturing Finance Act is well-timed.

Halloween candy aisles see shift amid sky-high cocoa prices
The soaring price of cocoa over the past year has pushed up the cost of chocolate, leading candy companies and consumers to lean toward other options this Halloween.

Hershey's new Cadbury Bunny is a rescue raccoon from Florida
Louie, a Miami-based pet raccoon, was recently named the winner of the 2024 Cadbury Bunny Tryouts from The Hershey Company, defeating a cat named Loki in the final vote.

Valentine's Day chocolates set to break hearts after cocoa prices hit record high
A shortage of cocoa due to crop damage in West Africa drove the price to a record high last week, just ahead of the Valentine's Day holiday as consumers feel the squeeze.
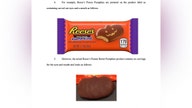
Hershey sued, accused of 'deception' in Reese's Peanut Butter Pumpkins
A Florida woman is seeking at least $5,000,000 from The Hershey Company after she says she was deceived by the company's advertisements for its seasonal items.
Reese’s Peanut Butter Cups aficionados baffled by correct pronunciation of fan-favorite candy
A spokesperson for Hershey's Chocolate recently cleared up the confusion surrounding how to properly pronounce Reese’s Peanut Butter Cups.