About fortinet inc. - FTNT
Fortinet, Inc. provides cybersecurity solutions to a variety of businesses, such as enterprises, communication service providers, government organizations, and small to medium-sized businesses. Its product portfolio includes network security, secure access service edge, enterprise networking, security operations, application security, and operational technology. The company was founded by Ken Xie and Michael Xie in November 2000 and is headquartered in Sunnyvale, CA.
FTNT At a Glance
Fortinet, Inc.
909 Kifer Road
Sunnyvale, California 94086
| Phone | 1-408-235-7700 | Revenue | 6.80B | |
| Industry | Information Technology Services | Net Income | 1.85B | |
| Sector | Technology Services | 2025 Sales Growth | 14.168% | |
| Fiscal Year-end | 12 / 2026 | Employees | 15,109 | |
| View SEC Filings |
FTNT Valuation
| P/E Current | 56.132 |
| P/E Ratio (with extraordinary items) | N/A |
| P/E Ratio (without extraordinary items) | 32.76 |
| Price to Sales Ratio | 8.929 |
| Price to Book Ratio | 47.678 |
| Price to Cash Flow Ratio | 23.44 |
| Enterprise Value to EBITDA | 26.14 |
| Enterprise Value to Sales | 8.559 |
| Total Debt to Enterprise Value | 0.018 |
FTNT Efficiency
| Revenue/Employee | 450,036.402 |
| Income Per Employee | 122,668.608 |
| Receivables Turnover | 4.021 |
| Total Asset Turnover | 0.675 |
FTNT Liquidity
| Current Ratio | 1.172 |
| Quick Ratio | 1.093 |
| Cash Ratio | 0.712 |
FTNT Profitability
| Gross Margin | 80.456 |
| Operating Margin | 30.506 |
| Pretax Margin | 33.564 |
| Net Margin | 27.257 |
| Return on Assets | 18.394 |
| Return on Equity | 135.716 |
| Return on Total Capital | 80.607 |
| Return on Invested Capital | 86.245 |
FTNT Capital Structure
| Total Debt to Total Equity | 85.802 |
| Total Debt to Total Capital | 46.179 |
| Total Debt to Total Assets | 10.22 |
| Long-Term Debt to Equity | 42.505 |
| Long-Term Debt to Total Capital | 22.877 |
Fortinet Inc. in the News
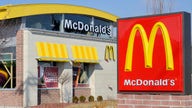
Calls to boycott McDonald's, other brands in wake of Russia's invasion of Ukraine
Major global brands, including McDonald's Corp, PepsiCo Inc. and the Estee Lauder Cos Inc. should consider pausing their operations in Russia, New York state's pension fund chief wrote in letters to several companies on Friday.
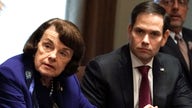
Senators push bipartisan bill to sanction nations involved with ransomware attacks
Top senators on the Senate Intelligence Committee introduced bipartisan legislation Thursday that seeks to sanction any nation involved in ransomware attacks against the U.S.