About diamondback energy inc. - FANG
Diamondback Energy, Inc. is an independent oil and natural gas company, which engages in the acquisition, development, exploration, and exploitation of unconventional, onshore oil, and natural gas reserves. It operates through the Upstream and Midstream Services segments. The Upstream segment focuses on the Permian Basin operations in West Texas. The Midstream Services segment is involved in the Midland and Delaware Basins. The company was founded in December 2007 and is headquartered in Midland, TX.
FANG At a Glance
Diamondback Energy, Inc.
500 West Texas Avenue
Midland, Texas 79701
| Phone | 1-432-221-7400 | Revenue | 15.03B | |
| Industry | Oil & Gas Production | Net Income | 1.66B | |
| Sector | Energy Minerals | 2025 Sales Growth | 35.785% | |
| Fiscal Year-end | 12 / 2026 | Employees | 1,762 | |
| View SEC Filings |
FANG Valuation
| P/E Current | 211.873 |
| P/E Ratio (with extraordinary items) | N/A |
| P/E Ratio (without extraordinary items) | 26.242 |
| Price to Sales Ratio | 2.892 |
| Price to Book Ratio | 1.157 |
| Price to Cash Flow Ratio | 4.96 |
| Enterprise Value to EBITDA | 6.492 |
| Enterprise Value to Sales | 4.274 |
| Total Debt to Enterprise Value | 0.232 |
FANG Efficiency
| Revenue/Employee | 8,527,809.308 |
| Income Per Employee | 939,841.09 |
| Receivables Turnover | 10.841 |
| Total Asset Turnover | 0.217 |
FANG Liquidity
| Current Ratio | 0.416 |
| Quick Ratio | 0.398 |
| Cash Ratio | 0.023 |
FANG Profitability
| Gross Margin | 35.159 |
| Operating Margin | 32.311 |
| Pretax Margin | 12.472 |
| Net Margin | 11.021 |
| Return on Assets | 2.394 |
| Return on Equity | 4.433 |
| Return on Total Capital | 3.194 |
| Return on Invested Capital | 3.295 |
FANG Capital Structure
| Total Debt to Total Equity | 40.244 |
| Total Debt to Total Capital | 28.696 |
| Total Debt to Total Assets | 20.939 |
| Long-Term Debt to Equity | 37.125 |
| Long-Term Debt to Total Capital | 26.472 |
Diamondback Energy Inc. in the News
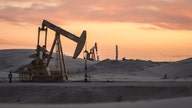
Oil executives predict 2026 price 'low point' as Permian Basin ramps up production capacity
America's oil magnates are prepared for prices to be lower next year, as supply on Texas' Permian Basin ramps up to account for 40% of U.S. oil production in the near future.

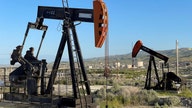
Diamondback in $26B deal to buy Endeavor Energy in growing Permian push
The combined company would be the third-largest oil and gas producer in the region behind Exxon and Chevron, with both firms having announced recent deals.
Oil prices bubble ahead of OPEC meeting
Oil prices are moving higher ahead of the Organization of the Petroleum Exporting Countries (OPEC) meeting scheduled for Thursday, after the alliance delayed the event last week.