enbridge inc. - ENB

ENB

Close Chg Chg %
54.18 0.26 0.48%

Pre-Market

54.44

+0.26 (0.48%)

Volume: 5.00M

Last Updated:

Mar 24, 2026, 3:59 PM EDT

Company Overview: enbridge inc. - ENB

ENB Key Data

Open

$54.17

Day Range

53.93 - 55.11

52 Week Range

39.73 - 55.11

Market Cap

$118.17B

Shares Outstanding

2.18B

Public Float

2.18B

Beta

0.66

Rev. Per Employee

N/A

P/E Ratio

23.39

EPS

$2.31

Yield

507.56%

Dividend

$0.71

EX-DIVIDEND DATE

Feb 17, 2026

SHORT INTEREST

N/A

AVERAGE VOLUME

4.68M


ENB Performance

1 Week
 
1.31%
 
1 Month
 
1.92%
 
3 Months
 
13.95%
 
1 Year
 
21.82%
 
5 Years
 
46.06%
 

ENB Analyst Ratings

  • Sell
  • Under
  • Hold
  • Over
  • Buy
Number of Ratings 24
Full Ratings ➔

About enbridge inc. - ENB

Enbridge, Inc. engages in the provision of gas and oil. It operates through the following segments: Liquid Pipelines, Gas Distribution and Storage, Gas Transmission and Midstream, Renewable Power Generation, and Energy Services. The Liquids Pipelines segment consists of common carrier and contract crude oil, natural gas liquids and refined products pipelines and terminals in Canada and the U.S., including Canadian Mainline, Regional Oil Sands System, Southern Lights Pipeline, Spearhead Pipeline, Seaway Crude Pipeline interest, and other feeder pipelines. The Gas Distribution & Storage segment consists of natural gas utility operations, the core of which is Enbridge gas, which serves residential, commercial and industrial customers. It also includes natural gas distribution activities in Quebec and an investment in Noverco, which holds a majority interest in a subsidiary entity engaged in distribution and energy transportation primarily in Quebec. The Gas Transmission & Midstream segment consists of investments in natural gas pipelines, processing and green energy projects, the company's commodity marketing businesses, and international activities. The Renewable Power Generation segment consists primarily of investments in wind and solar power generating assets, as well as geothermal, waste heat recovery, and transmission assets. The Energy Services segment consists of businesses in Canada and the United States including logistical services, refinery supply services and the firm's volume commitments on various pipeline systems. The company was founded on April 30, 1949 and is headquartered in Calgary, Canada.

ENB At a Glance

Enbridge, Inc.
Fifth Avenue Place
Calgary, Alberta T2P 3L8
Phone 1-403-231-3900 Revenue 46.61B
Industry Oil & Gas Pipelines Net Income 5.36B
Sector Industrial Services 2025 Sales Growth 19.156%
Fiscal Year-end 12 / 2026 Employees 14,800
View SEC Filings

ENB Valuation

P/E Current 23.392
P/E Ratio (with extraordinary items) N/A
P/E Ratio (without extraordinary items) 20.695
Price to Sales Ratio 2.247
Price to Book Ratio 2.582
Price to Cash Flow Ratio 11.30
Enterprise Value to EBITDA 15.593
Enterprise Value to Sales 4.05
Total Debt to Enterprise Value 0.409

ENB Efficiency

Revenue/Employee 3,149,245.985
Income Per Employee 362,236.306
Receivables Turnover 8.504
Total Asset Turnover 0.299

ENB Liquidity

Current Ratio 0.628
Quick Ratio 0.551
Cash Ratio 0.056

ENB Profitability

Gross Margin 32.612
Operating Margin 17.279
Pretax Margin 15.037
Net Margin 11.502
Return on Assets 3.441
Return on Equity 11.745
Return on Total Capital 4.368
Return on Invested Capital 4.674

ENB Capital Structure

Total Debt to Total Equity 169.923
Total Debt to Total Capital 62.952
Total Debt to Total Assets 48.481
Long-Term Debt to Equity 179.321
Long-Term Debt to Total Capital 59.168
  • Income Statement
  • Balance Sheet
  • Cash Flow Statement

Annual Financials for Enbridge Inc. - ENB

Collapse All in section
All values USD millions. 2022 2023 2024 2025 5-year trend
Sales/Revenue
41.05B 31.77B 39.12B 46.61B
Sales Growth
+9.97% -22.60% +23.10% +19.16%
Cost of Goods Sold (COGS) incl D&A
28.27B 19.18B 24.95B 31.41B
COGS excluding D&A
- - - -
-
Depreciation & Amortization Expense
3.32B 3.42B 3.77B 4.05B
Depreciation
2.95B 3.02B 3.38B 3.67B
Amortization of Intangibles
371.01M 396.39M 386.87M 382.17M
COGS Growth
+8.53% -32.16% +30.08% +25.90%
Gross Income
12.78B 12.60B 14.17B 15.20B
Gross Income Growth
+13.30% -1.46% +12.49% +7.28%
Gross Profit Margin
+31.14% +39.64% +36.22% +32.61%
2022 2023 2024 2025 5-year trend
SG&A Expense
6.35B 6.32B 6.87B 7.15B
Research & Development
- - - -
-
Other SG&A
6.35B 6.32B 6.87B 7.15B
SGA Growth
+18.61% -0.58% +8.70% +4.07%
Other Operating Expense
- - - -
-
Unusual Expense
2.43B (597.18M) 1.67B (546.77M)
EBIT after Unusual Expense
4.00B 6.88B 5.63B 8.60B
Non Operating Income/Expense
254.25M 1.79B 2.97B 2.01B
Non-Operating Interest Income
- - - -
-
Equity in Earnings of Affiliates
- 1.35B 1.68B 1.59B
Interest Expense
2.34B 2.83B 3.27B 3.60B
Interest Expense Growth
+21.75% +20.95% +15.53% +10.16%
Gross Interest Expense
2.40B 2.91B 3.39B 3.79B
Interest Capitalized
56.84M 74.83M 117.52M 182.50M
Pretax Income
1.91B 5.84B 5.33B 7.01B
Pretax Income Growth
-60.22% +205.70% -8.73% +31.55%
Pretax Margin
+4.65% +18.37% +13.62% +15.04%
Income Tax
1.23B 1.35B 1.22B 1.43B
Income Tax - Current - Domestic
276.53M 74.09M 181.03M 700.64M
Income Tax - Current - Foreign
- 220.45M 223.01M 511.69M
Income Tax - Deferred - Domestic
(274.99M) 337.86M (218.25M) 733.56M
Income Tax - Deferred - Foreign
- 1.01B 714.24M 743.09M
Income Tax Credits
- - - -
-
Equity in Earnings of Affiliates
- 1.35B 1.68B 1.59B
Other After Tax Income (Expense)
- - - -
-
Consolidated Net Income
2.26B 4.49B 4.11B 5.57B
Minority Interest Expense
(49.93M) (98.54M) 138.69M 213.27M
Net Income
2.31B 4.59B 3.97B 5.36B
Net Income Growth
-53.27% +98.85% -13.42% +34.98%
Net Margin Growth
+5.62% +14.44% +10.15% +11.50%
Extraordinaries & Discontinued Operations
- - - -
-
Discontinued Operations
- - - -
-
Net Income After Extraordinaries
2.31B 4.59B 3.97B 5.36B
Preferred Dividends
318.01M 260.80M 283.22M 299.87M
Net Income Available to Common
1.99B 4.33B 3.69B 5.06B
EPS (Basic)
0.9821 2.1042 1.7116 2.3217
EPS (Basic) Growth
-57.17% +114.26% -18.66% +35.65%
Basic Shares Outstanding
2.02B 2.06B 2.15B 2.18B
EPS (Diluted)
0.9801 2.1021 1.7092 2.3153
EPS (Diluted) Growth
-57.22% +114.48% -18.69% +35.46%
Diluted Shares Outstanding
2.03B 2.06B 2.16B 2.19B
EBITDA
9.74B 9.70B 11.07B 12.10B
EBITDA Growth
+8.30% -0.49% +14.20% +9.32%
EBITDA Margin
+23.73% +30.52% +28.31% +25.97%

Snapshot

Average Recommendation HOLD Average Target Price 55.32
Number of Ratings 24 Current Quarters Estimate 0.721
FY Report Date 03 / 2026 Current Year's Estimate 2.191
Last Quarter’s Earnings 0.645 Median PE on CY Estimate N/A
Year Ago Earnings 2.215 Next Fiscal Year Estimate 2.348
Median PE on Next FY Estimate N/A

Earnings Per Share

This Quarter Next Quarter This Fiscal Next Fiscal
# of Estimates 11 10 17 17
Mean Estimate 0.72 0.47 2.19 2.35
High Estimates 0.81 0.51 2.35 2.58
Low Estimate 0.61 0.41 1.92 2.20
Coefficient of Variance 8.84 6.58 5.94 4.98

Analysts Recommendations

Current 1 Month Ago 3 Months Ago
BUY 7 7 9
OVERWEIGHT 1 1 1
HOLD 14 15 14
UNDERWEIGHT 1 0 0
SELL 1 1 1
MEAN Hold Overweight Overweight

Enbridge Inc. in the News

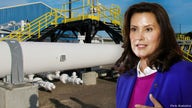
Pipeline battle: Enbridge defies Michigan closure orders

The more than six-decade-old Line 5 pipeline transports up to 23 million gallons of oil and natural gas liquids per day from Superior, Wisconsin to Sarnia, Ontario, taking a shortcut through Michigan and along the lake bottom of the Straits of Mackinac.