continental ag - CTTAY

CTTAY

Close Chg Chg %
6.85 0.12 1.76%

Open Market

6.97

+0.12 (1.76%)

Volume: 97.35K

Last Updated:

Mar 25, 2026, 1:59 PM EDT

Company Overview: continental ag - CTTAY

CTTAY Key Data

Open

$6.86

Day Range

6.86 - 7.08

52 Week Range

6.21 - 9.19

Market Cap

$13.78B

Shares Outstanding

2.00B

Public Float

N/A

Beta

1.11

Rev. Per Employee

N/A

P/E Ratio

N/A

EPS

-$0.11

Yield

287.45%

Dividend

$1.86

EX-DIVIDEND DATE

Sep 23, 2025

SHORT INTEREST

N/A

AVERAGE VOLUME

168.15K


CTTAY Performance

1 Week
 
2.85%
 
1 Month
 
-21.46%
 
3 Months
 
-12.85%
 
1 Year
 
-4.60%
 
5 Years
 
-48.26%
 

CTTAY Analyst Ratings

  • Sell
  • Under
  • Hold
  • Over
  • Buy
Number of Ratings 16
Full Ratings ➔

About continental ag - CTTAY

Continental AG is a holding company, which engages in the provision of manufacture and sale of soft rubber products, rubberized fabrics, and solid tires. It operates through the following segments: Automotive, Tires, ContiTech, Contract Manufacturing, and Other/Holding/Consolidation. The Automotive segment comprises technologies for passive safety, brake, chassis, and motion and motion control systems. The Tires segment focuses on the provision of tire technology solutions. The ContiTech segment specializes in developing and manufacturing cross-material, products and systems for the automotive industry. The Contract Manufacturing segment is involved in the contract manufacturing of products. The Other/Holding/Consolidation segment refers to centrally managed subsidiaries and affiliates. The company was founded on October 8, 1871 and is headquartered in Hanover, Germany.

CTTAY At a Glance

Continental AG
Vahrenwalder Strasse 9
Hannover, Niedersachsen (Lwr Saxony) 30165
Phone 49-511-938-1080 Revenue 22.21B
Industry Automotive Aftermarket Net Income -186,215,361.85
Sector Consumer Durables Employees 92,653
Fiscal Year-end 12 / 2026
View SEC Filings

CTTAY Valuation

P/E Current N/A
P/E Ratio (with extraordinary items) N/A
P/E Ratio (without extraordinary items) N/A
Price to Sales Ratio 0.719
Price to Book Ratio 3.455
Price to Cash Flow Ratio 6.45
Enterprise Value to EBITDA 6.924
Enterprise Value to Sales 1.005
Total Debt to Enterprise Value 0.359

CTTAY Efficiency

Revenue/Employee 239,667.358
Income Per Employee -2,009.815
Receivables Turnover 5.109
Total Asset Turnover 0.724

CTTAY Liquidity

Current Ratio 1.281
Quick Ratio 0.867
Cash Ratio 0.222

CTTAY Profitability

Gross Margin 25.915
Operating Margin 9.067
Pretax Margin -0.198
Net Margin -0.839
Return on Assets -1.638
Return on Equity -5.156
Return on Total Capital -3.974
Return on Invested Capital -3.426

CTTAY Capital Structure

Total Debt to Total Equity 173.513
Total Debt to Total Capital 63.439
Total Debt to Total Assets 36.959
Long-Term Debt to Equity 120.768
Long-Term Debt to Total Capital 44.154
  • Income Statement
  • Balance Sheet
  • Cash Flow Statement

Annual Financials for Continental Ag - CTTAY

Collapse All in section
All values USD millions. 2022 2023 2024 2025 5-year trend
Sales/Revenue
41.42B 44.78B 42.96B 22.21B
Sales Growth
+3.78% +8.12% -4.06% -48.31%
Cost of Goods Sold (COGS) incl D&A
32.69B 35.26B 33.44B 16.45B
COGS excluding D&A
- - - -
-
Depreciation & Amortization Expense
2.36B 2.34B 2.35B 1.21B
Depreciation
- 2.10B 2.11B 2.13B
Amortization of Intangibles
- 256.86M 235.14M 224.99M
COGS Growth
+6.26% +7.87% -5.15% -50.81%
Gross Income
8.73B 9.52B 9.52B 5.75B
Gross Income Growth
-4.56% +9.05% -0.03% -39.55%
Gross Profit Margin
+21.08% +21.26% +22.16% +25.91%
2022 2023 2024 2025 5-year trend
SG&A Expense
8.26B 8.32B 8.41B 3.65B
Research & Development
4.38B 4.46B 4.43B 653.45M
Other SG&A
3.89B 3.86B 3.98B 3.00B
SGA Growth
+0.66% +0.70% +1.07% -56.57%
Other Operating Expense
(147.56M) 137.09M 210.93M 89.16M
Unusual Expense
1.36B 460.77M 336.41M 931.08M
EBIT after Unusual Expense
(743.67M) 604.13M 563.56M 1.08B
Non Operating Income/Expense
1.48B 1.46B 1.83B (783.23M)
Non-Operating Interest Income
88.70M 113.08M 111.41M 90.29M
Equity in Earnings of Affiliates
- - - -
-
Interest Expense
185.18M 362.71M 389.41M 343.09M
Interest Expense Growth
+34.02% +95.87% +7.36% -11.90%
Gross Interest Expense
185.18M 362.71M 389.41M 343.09M
Interest Capitalized
- - - -
-
Pretax Income
555.44M 1.70B 2.01B (44.01M)
Pretax Income Growth
-71.60% +206.11% +18.08% -102.19%
Pretax Margin
+1.34% +3.80% +4.67% -0.20%
Income Tax
467.26M 458.50M 744.20M 433.37M
Income Tax - Current - Domestic
109.20M 83.35M 94.11M 24.83M
Income Tax - Current - Foreign
638.47M 731.81M 776.65M 460.46M
Income Tax - Deferred - Domestic
85.76M (221.74M) 131.97M 47.40M
Income Tax - Deferred - Foreign
(366.16M) (134.92M) (258.52M) (99.31M)
Income Tax Credits
- - - -
-
Equity in Earnings of Affiliates
- - - -
-
Other After Tax Income (Expense)
- - - -
-
Consolidated Net Income
117.92M 1.29B 1.30B (468.36M)
Minority Interest Expense
47.92M 40.54M 34.61M 33.86M
Net Income
69.99M 1.25B 1.26B (502.22M)
Net Income Growth
-95.44% +1,686.13% +1.06% -139.75%
Net Margin Growth
+0.17% +2.79% +2.94% -2.26%
Extraordinaries & Discontinued Operations
- - - 316.00M
-
Discontinued Operations
- - - 316.00M
-
Net Income After Extraordinaries
69.99M 1.25B 1.26B (186.22M)
Preferred Dividends
- - - -
-
Net Income Available to Common
69.99M 1.25B 1.26B (186.22M)
EPS (Basic)
0.035 0.6251 0.6317 -0.0931
EPS (Basic) Growth
-95.93% +1,686.00% +1.06% -114.74%
Basic Shares Outstanding
2.00B 2.00B 2.00B 2.00B
EPS (Diluted)
0.035 0.6251 0.6317 -0.0931
EPS (Diluted) Growth
-95.93% +1,686.00% +1.06% -114.74%
Diluted Shares Outstanding
2.00B 2.00B 2.00B 2.00B
EBITDA
2.97B 3.41B 3.25B 3.22B
EBITDA Growth
-23.86% +14.57% -4.63% -0.84%
EBITDA Margin
+7.18% +7.61% +7.57% +14.52%

Snapshot

Average Recommendation OVERWEIGHT Average Target Price 8.666
Number of Ratings 16 Current Quarters Estimate 0.188
FY Report Date 03 / 2026 Current Year's Estimate 0.708
Last Quarter’s Earnings 0.026 Median PE on CY Estimate N/A
Year Ago Earnings -0.097 Next Fiscal Year Estimate 0.816
Median PE on Next FY Estimate N/A

Earnings Per Share

This Quarter Next Quarter This Fiscal Next Fiscal
# of Estimates 2 2 12 10
Mean Estimate 0.19 0.15 0.71 0.82
High Estimates 0.21 0.16 0.93 0.92
Low Estimate 0.16 0.14 0.48 0.68
Coefficient of Variance 19.29 6.17 15.89 8.36

Analysts Recommendations

Current 1 Month Ago 3 Months Ago
BUY 8 7 8
OVERWEIGHT 2 1 2
HOLD 6 8 4
UNDERWEIGHT 0 0 0
SELL 0 0 0
MEAN Overweight Overweight Overweight

Continental Ag in the News

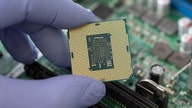
Carmakers get inventive as global chip crisis bites

Whether buying computer chips directly from manufacturers, reconfiguring cars, or producing them with parts missing, automakers are having to get creative to cope with the global shortage of semiconductors.