


Playing With Alphabet's Numbers
Sometimes a couple of adjustments to a company's reported numbers will bring the business into a different and more revealing light. This is true, I think, of the company formerly known as Google.
I'm speaking in particular of the way Alphabet reports the revenue it realizes from its network partners -- the websites that sign on to display Google's advertising and in return receive a cut, a very big cut, of the amount Google receives when those ads are clicked. These network revenues are reported gross -- that is to say, the entire amount Google receives from its advertisers is reported in the top line, and the portion remitted to the network partners is reported in cost of revenues as traffic acquisition costs (TAC).
I thought it would be a revealing exercise to net out TAC from both revenues and cost of revenues. For example, Google reported revenues of $66 billion last year and cost of revenues of $26 billion. If we take out $10 billion of TAC from both figures, we have revenues of $56 billion and costs of $16 billion. Note that the TAC figure I've used is only network-member TAC and not distribution TAC, which is a different matter. But more on that later.
According to The New York Times, this was how Google reported its revenues for internal purposes until right before its IPO in 2004, when it switched to the gross method, thereby boosting its 2004 revenues from $1.9 billion to $3.1 billion.
Net versus grossWith network revenues, Google is receiving the cash from its advertisers and paying a cut to the website owners. The situation is reminiscent of having a ticket seller such as Expedia or Priceline receive the gross of an airline ticket and then paying a big chunk of that amount to the airline. Should the full price of the ticket be reported in the top line? Or should we see there only the net amount, which is essentially a fee that the ticket seller receives for serving as a conduit between airline and passenger? That the issue is far from settled we can see from the different approaches Expedia and Priceline take. The former chooses to report its merchant revenues net; the latter, controversially, insists on the gross method.
The controversy is not just an academic one nor just a matter of what the revenues are or should be, but rather of which approach reveals more about the business and its cost structure. If we apply the net method to Google's numbers, a different and more revealing picture emerges.
First, network revenues would go from being a major part of Google's business to being almost a side issue. Reported gross, they averaged about 34% of total ad revenues since 2004. Reported net, this figure goes down to 11%.
The effect on cost of revenues would be even more dramatic. Traffic acquisition costs last year were 53% of the cost of revenues, down from 84% in 2004. Reported net, network TAC would of course disappear, and cost of revenues as a percentage of total revenues would in turn go down -- quite dramatically, in fact.
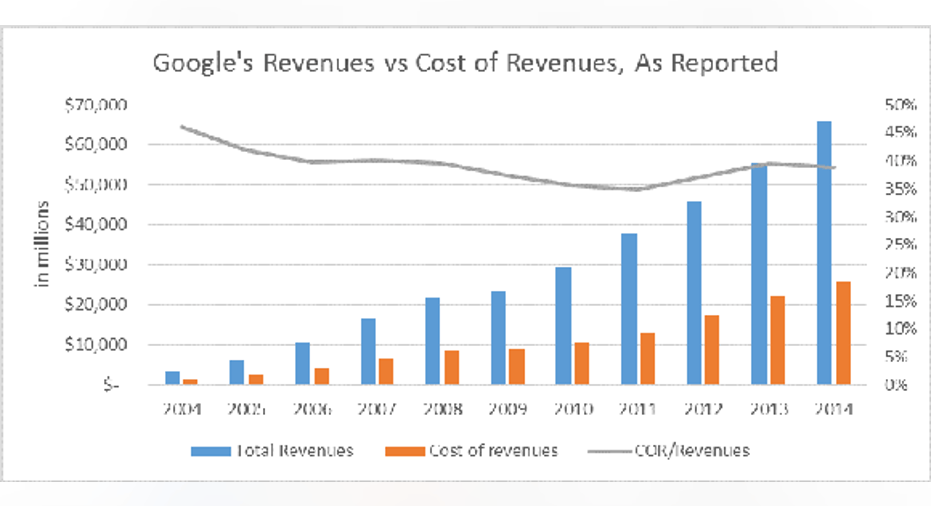
Here is where the advantage of netting traffic acquisition costs becomes really stark. If we use Google's numbers, we see the following trend in cost of revenues as a percentage of revenues:
Source: SEC filings and author's calculations.
The percentage (gray line) appears, if anything, to have decreased over time.
If instead we adjust the numbers by netting out the traffic acquisition costs, something different appears:
Source: SEC filings and author's calculations.
The percentage of costs to revenues is of course lower, but the direction of the trend is quite clearly up.
These adjusted numbers give Google's cost of revenues ex-traffic acquisition costs a greater say in the matter and reveal the trajectory of those costs, which have gone up quite steadily by 41%, annualized, over the past three years -- a time when adjusted revenues went up by 19%.
Network TAC vs. distribution TACThe traffic acquisition costs that I netted out in the calculations are the network traffic acquisition costs and not the distribution traffic acquisition costs. Both of these go by the name of TAC, but their nature is very different. Network TAC is made up of funds remitted to countless websites, many of which wouldn't even exist without Google to serve as a conduit for their ad revenues. Distribution TAC is a fee paid to companies in exchange for distributing Google's search box or otherwise directing traffic to Google. It's a true cost and one that has been increasing over the years at a rate of 35% since 2006, a period in which revenues increased by 20%.
Let's consider our cost of revenue figure once again. Unadjusted, it was $26 billion. If we make our adjustment by taking out network TAC, the figure goes down to $16 billion. Of this figure, $12 billion would be a potpourri of content acquisition costs, data center costs, and so on -- all under the heading "other cost of revenue." Google doesn't give us a detailed breakdown of these costs so we cannot see which are more or less significant.
The remaining $4 billion of that $16 billion cost figure is distribution TAC. At 23%, it's a major part. Just how major it is we'll see come next year, when the various components of "other cost of revenues" will be revealed with numbers attached.
The bottom lineHere's the basic gist of what appears from an adjusted view of Google's numbers:
1. Higher margins: Net income margin goes from 22% to 26%, and operating margin goes from 25% to 29%. The flip side, of course, is that the margins have been decreasing at a higher rate.
2. Network revenues are only 11% of total revenues, not as important as the reported numbers may suggest.
3. Cost of revenue as a percentage of revenue goes down, as mentioned, from 39% to 28%.
4. R&D expenses go up, from 15% of revenue to 18%.
5. Last but not least, distribution TAC may very well be the biggest portion of Google's cost of revenues.
The article Playing With Alphabet's Numbers originally appeared on Fool.com.
Benjamin Ra has no position in any stocks mentioned. The Motley Fool owns shares of and recommends Alphabet (A shares), Alphabet (C shares), and Priceline Group. Try any of our Foolish newsletter services free for 30 days. We Fools may not all hold the same opinions, but we all believe that considering a diverse range of insights makes us better investors. The Motley Fool has a disclosure policy.
Copyright 1995 - 2015 The Motley Fool, LLC. All rights reserved. The Motley Fool has a disclosure policy.