


News Flash, Investors: You're Really Not That Good, and the Data Proves It
Since the beginning of 1996, the broad-based S&P 500 (SNPINDEX: ^GSPC) has increased in value by roughly 280%, not including dividend reinvestment. Do you think you've beaten this widely followed index as an investor over this time span? If you do, you're probably lying to yourself.
The average investor is pretty terrible, new data shows
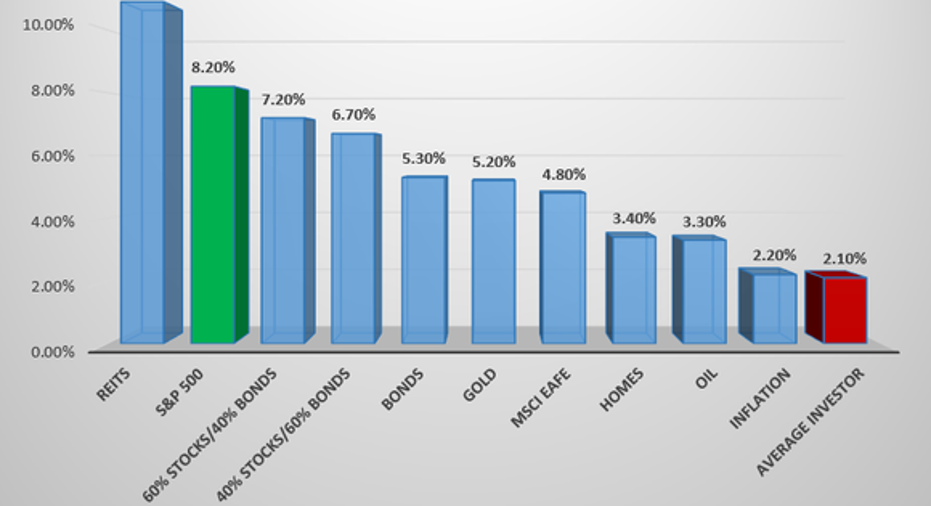
According to new data from J.P. Morgan Asset Management that was released during the first quarter, the average investor underperformed practically every asset allocation and measure you could possibly think of over the 20-year period between 1996 and 2015:
Data source: J.P. Morgan Asset Management. Chart by author.
You'll note that the top-performing asset on an annual basis over this 20-year period were real estate investment trusts (REITs). This isn't all too shocking, since REITs have been able to take advantage of historically low lending rates to borrow money and boost their leverage to increase their cash flow and pay out handsome dividends. An average annual return of 10.9% is certainly nothing to scoff at.
Simply holding the S&P 500 over this 20-year period would also have netted a healthy annual return of 8.2%. Had you gone with a traditional mix of stocks and bonds, say 60% stocks/40% bonds, or the reverse of 40%/60%, you'd have generated a pretty nice annual average return of 7.2% and 6.7%, respectively.
Commodities didn't perform nearly as well as REITs, stocks, or bonds, but they still outperformed the average investor who, as you can see above, generated a return of a measly 2.1% per year over this 20-year period. You'll note that with inflation average 2.2% per year, the average investor actually lost real money between 1996 and 2015.
Why we stink at investing
Why are we so terrible at investing?
It's tough to concretely say without knowing where the bulk of investors had their money over the past 20 years. If they had tied their money up in homes, oil, or even gold to some extent, they would have handily underperformed stocks. But, there's still a noticeable gap in underperformance between the average investor and oil, homes, or gold. I'd surmise that the likely reason for this gap, and the underperformance of the average investor, is impatience.
Image source: Getty Images.
The data is pretty clear: if investors had held through both the dot-com bubble and the Great Recession, two events that saw the S&P 500 tumbled by roughly half its value, they would still have generated an 8.2% average return over 20 years. With inflation running at 2.2%, this would have translated into a 6% real-money return. Not too shabby.
However, with the average investor underperforming by 6.1% per year for 20 years, the only logical explanation is that investors abandoned their investments (specifically stocks) at an inopportune time and missed out on the subsequent rebound in equity valuations. This is especially true for a number of baby boomers who witnessed their stock investments get beaten up pretty badly during the Great Recession, and who chose to exit the stock market entirely.
In short, emotions and short-sightedness appear to be holding the average investor back.
How to break the cycle
The good news is we can break this cycle of underperformance, but it will take some discipline on the part of the average investor.
One of the smartest moves you can make as a long-term investor is to space out your purchases into regular intervals. If you're buying stock(s) every week, month, quarter, or year, regardless of where the major market indexes are priced, you'll remove a lot of the emotion and angst tied with investing. Buying in regular intervals should reduce or eliminate the fear that you're not getting the best buy-in price on your investments, and over the long run it'll average you into what should be an attractive cost basis.
Image source: Getty Images.
To build upon the first point, investors should also strongly consider setting up an automatic withdrawal from either their checking or savings account, or via their paycheck, that can be invested. Procrastination is possibly the number one enemy of investors. Thus, if you can remove the "I'll save later" mentality from the equation and ensure that a set amount of money is heading over to your brokerage or investment accounts on a regular basis, you'll have a better chance of succeeding over the long run.
And don't fret about the amount of money you're putting toward your regular investments, either. There are a number of investment services, such as Capital One Investing, that have no minimum amount of money required to open an account. With Capital One Investing, you can contribute $25 a week, or any amount you'd like at any regular interval, to be invested in equities of your choosing.
Finally, investors have to learn to trust in the data. Nothing is a given in the stock market, but the data suggests that stock valuations rising over the long run is the closest thing you may ever get to a certainty. Since 1950, according to data from Yardeni Research, the S&P 500 has undergone 35 stock market corrections of 10% or more, when rounded to the nearest whole number. Yet given a few weeks, months, or in rarer cases years, a bull market rally has completely erased each and every decline.
Historically, the stock market has increased in value by an average of 7% per year, inclusive of dividend reinvestment. The data very much suggests that if you stay invested in great stocks or even index funds over the long run, you'll most likely come out a winner.
10 stocks we like better thanWal-MartWhen investing geniuses David and TomGardner have a stock tip, it can pay to listen. After all, the newsletter theyhave run for over a decade, the Motley Fool Stock Advisor, has tripled the market.*
David and Tomjust revealed what they believe are theten best stocksfor investors to buy right now... and Wal-Mart wasn't one of them! That's right -- theythink these 10 stocks are even better buys.
Click hereto learn about these picks!
*StockAdvisor returns as of April 3, 2017The author(s) may have a position in any stocks mentioned.
Sean Williams has no position in any stocks mentioned. The Motley Fool has no position in any of the stocks mentioned. The Motley Fool has a disclosure policy.