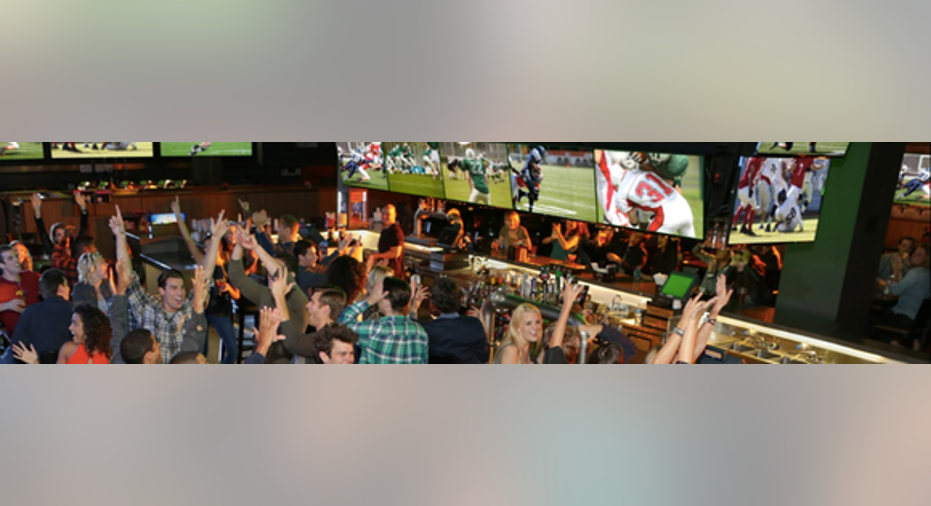
Dave & Busters Continues to Buck the Trend

Few restaurant investors have enjoyed success over the past year that matches that enjoyed by investors in Dave & Buster's (NASDAQ: PLAY). In the face of industry dynamics that seem to be taking their toll on fast-growing upstarts and well-established players alike, shares of the company had advanced 60% over the past year leading up to Tuesday night's fourth-quarter earnings release. And investors were hoping for continued good news.
Indeed, the company continued to buck the trend in the most recent quarter, showing a 3.2% increase in comparable-store sales (comps). But the outlook offered up by management may have left some wondering if the great run might be coming to an end.
Image source: Dave & Buster's.
Dave & Buster's results: The raw numbers
We'll get into the specifics of the quarter below, including what made it so exceptional. But first, let's review the headline numbers.
|
Metric |
Q4 2016 |
Q4 2015 |
Year-Over-Year Change |
|---|---|---|---|
|
Revenue |
$270 million |
$234 million |
15% |
|
EPS |
$0.63 |
$0.53 |
19% |
Data source: SEC filings. EPS stands for earnings per share.
While free cash flow was down significantly from the same time one year ago, it has more than doubled over the entire fiscal year, to $51 million. That's a significantly strong sign when you consider that much of that free cash flow is being eaten away by the company's reinvestment in building new locations.
To have that much left over is important, and management highlighted it in its press release, saying: "Our consistent performance and industry-leading margins position us well for our next growth phase. At the same time, our free cash flow and strong balance sheet allow flexibility to return value to shareholders in additional ways, including share repurchases."
Equally important, the company continues to show strength in comps. To put it in context, here's where the company has been in this key metric over the past 10 quarters.
Dave & Buster's Comps.Create column charts.
While no one likes seeing a deceleration, it's once again significant that comps are increasing during a time when many U.S.-based restaurants are seeing comps shrink.
Digging into the numbers
Dave & Buster's has two operating segments: food and beverage, and amusements and other. The food and beverage segment typically benefits from the company's focus on providing an appealing locale for sporting events -- like, during the most recent quarter, the Super Bowl.
But it's the company's amusement offerings that set it apart from the competition. No other national chain focuses on providing gaming experiences for young and old alike quite like Dave & Buster's. That helps provide a moat surrounding the company's main value proposition.
For the quarter, amusement and other accounted for 53.4% of all revenues, up from 51.7% last year. Overall, comps for amusement increased an impressive 6.9%. That's an important increase, as these amusement games tend to be much higher-margin offerings than food and beverages.
It's also important to note that, of the 91 stores Dave & Buster's was operating at the beginning of the year, a full 26 were not in the comp base. (In other words, they were new stores.) These stores performed remarkably well, according to CEO Steve King: "During the first full year of operation, our 2015 class of stores generated nearly 52% first year cash-on-cash return, significantly above our target." It will be very interesting to see how comps perform as these stores move into the comp base in the next year.
As mentioned above, management also pointed out that 396,000 shares were repurchased during the quarter, reducing the number of shares outstanding by a little less than 1%.
The outlook moving forward
Management currently believes that there is a possibility for more than 200 store locations in North America. That means there's a long runway for growth, as the current store count is fewer than 100. For the next fiscal year, management expects to open 11 to 12 new stores -- and to continue expanding by around 10% for a number of years.
Management also offered guidance for all of fiscal 2017. This included:
|
Metric |
2017 Guidance |
2016 Results |
Growth (at midpoint) |
|---|---|---|---|
|
Revenue |
$1.155 billion to $1.170 billion |
$1.005 billion |
16% |
|
Net income |
$101 million to $105 million |
$90.8 million |
13% |
|
Comps (fiscal 2016) |
2% to 3% |
3.30% |
20 basis points |
Data source: Dave & Buster's and SEC filings.
Speaking on the company's somewhat conservative outlook for comps in the year ahead, King said:
Simply put, that's what happens in the restaurant industry when you're successful: cannibalization when you expand, and competition as others begin to offer similar products. All management can do is be clear with investors about what to expect, and King seems to be doing a good job of that.
10 stocks we like better than Dave and Buster's EntertainmentWhen investing geniuses David and Tom Gardner have a stock tip, it can pay to listen. After all, the newsletter they have run for over a decade, Motley Fool Stock Advisor, has tripled the market.*
David and Tom just revealed what they believe are the 10 best stocks for investors to buy right now... and Dave and Buster's Entertainment wasn't one of them! That's right -- they think these 10 stocks are even better buys.
Click here to learn about these picks!
*Stock Advisor returns as of February 6, 2017
Brian Stoffel has no position in any stocks mentioned. The Motley Fool recommends Dave and Buster's Entertainment. The Motley Fool has a disclosure policy.


