


Chart Industries, Inc. Stock Down 12% on Fourth-Quarter Loss: Here's What's Happening
What happened
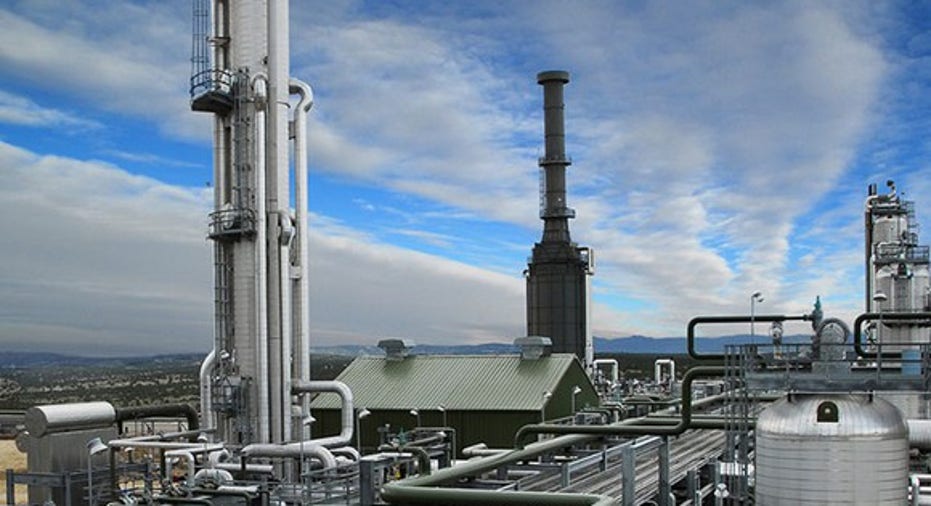
Shares of cryogenic gas processing, handling, and storage equipment manufacturer Chart Industries, Inc. (NASDAQ: GTLS) are down more than 12% at 12:50 p.m. EST on Feb. 23, following the pre-market release of the company's fourth-quarter and full-year 2016 financial results.
The results were far worse than Wall Street analysts were expecting, with the company reporting adjusted breakeven profits, while analysts were looking for earnings per share of $0.09 on average. On a GAAP (generally accepted accounting principles) basis, Chart reported a net loss of $3.3 million or $0.11 per share.
The weak energy industry has continued to weigh on Chart's results. Image source: Chart Industries.
So what
While Chart did indeed fall short of analyst expectations in the quarter, there's more to it than just the headline numbers. Chart's GAAP loss was a surprise, but it was entirely related to steps management is taking to better position the company, making it leaner and more profitable.
In the quarter, the company had $4.7 million in restructuring and severance-related expenses that are nonrecurring, related to the company's plan to relocate its headquarters from Ohio to Georgia, the consolidation of its biomedical respiratory facilities, and the consolidation of multiple Chinese facilities into a single location. In all, the company expects these moves will save $10 million per year in expenses.
While Chart did finish the year on a somewhat disappointing note, with a loss and more consolidation expenses, 2016 was undeniably a positive one. The company delivered $28.2 million in net earnings, good for $0.91 per share in 2016, after a huge $203 million -- $6.66 per share -- loss in 2015. This turnaround from losses to profits came even with sales down 17% from the year before, and was largely because of the painful consolidation and cost-cutting management implemented the year before.
For 2017, Chart's outlook is for sales between $875 million and $925 million. That's good for as poor as a 6% decline to as good as an 8% gain from 2016, a wide range based on the uncertain climate for capital spending in the oil and gas industry. Adjusted earnings guidance is between $0.60 and $1.00 per share, compared to $1.12 per share adjusted earnings in 2016.
Now what
Chart's shares are on the retreat today in part because the results missed Wall Street's expectations, and in part because its guidance for sales and earnings in 2017 leaves room for further deterioration in the business. At the same time, Chart's shares have doubled over the past year, and it's likely that at least some of today's decline is a product of "profit-taking," and less a sign of a business in trouble.
To the contrary, Chart's guidance for 2017, like its full-year results in 2016, indicate that the company has pretty much stabilized things, and management is still taking steps to strengthen it for the long term. The $4.7 million in nonrecurring expenses in the fourth quarter that will reduce expenses $10 million per year, for instance, are a prime example.
Eventually, investment in the oil and gas industry will recover. When it does, the things Chart's management has done to strengthen the company over the past couple of years should position the business for big success.
10 stocks we like better than Chart IndustriesWhen investing geniuses David and Tom Gardner have a stock tip, it can pay to listen. After all, the newsletter they have run for over a decade, Motley Fool Stock Advisor, has tripled the market.*
David and Tom just revealed what they believe are the 10 best stocks for investors to buy right now... and Chart Industries wasn't one of them! That's right -- they think these 10 stocks are even better buys.
Click here to learn about these picks!
*Stock Advisor returns as of February 6, 2017
Jason Hall owns shares of Chart Industries. The Motley Fool owns shares of and recommends Chart Industries. The Motley Fool has a disclosure policy.