


2017 Tax Tables: What You Need to Know Now
It's useful to know as early as possible how much in taxes you can expect to owe, and the tax tables that the Internal Revenue Service produces are what the vast majority of taxpayers use to figure out their final tax bill.
If you have taxable income of $100,000 or less, then you'll end up using the IRS tax tables to find the amount of tax to put on your return. Surprisingly, the IRS typically waits until the last possible minute before producing tax tables, and so you can't even find the official final 2016 tax tables on the IRS website as of this writing in late November. Those are the ones you'll need in early 2017 to file your 2016 tax return.
However, the tax brackets on which the 2017 tax tables will be based are already available, so you can come up with an estimate even though you'll likely have to wait a full year before the 2017 tax tables come out. We'll share those 2017 tax brackets below, but first, let's look at why tax tables are so much easier to use.
Image source: Getty Images.
Why tax tables are simpler than tax brackets
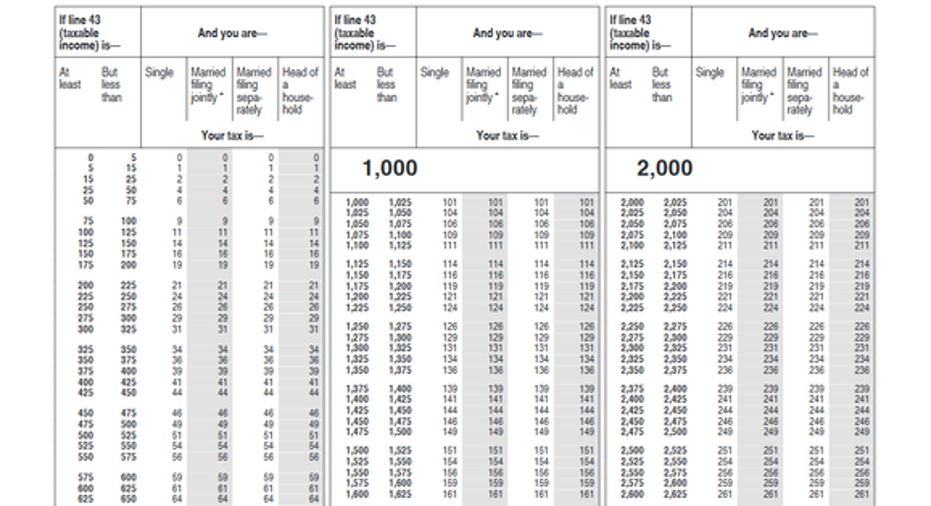
The benefit of the IRS tax tables is their simplicity. As you can see below, all you need to do is take your taxable income from your return, find the column for your filing status, and read down the column until you find the row with your income in it. The number at the intersection of the row and column is your tax. There's no math involved at all.
Image source: IRS.
For instance, in the tax table above, say a single filer had taxable income of $2,488. $2,488 is between $2,475 and $2,500, so looking down the single column on the right side, the tax will be $249.
Figuring out your tax without tax tables
The IRS waits so long before providing updated tax tables just in case there's a last-minute law change that affects tax returns for that tax year. But because tax brackets are necessary for purposes of figuring estimated taxes, the IRS provides them before the tax year even begins. For 2017, the tax brackets are as follows:
|
Tax Rate |
Single |
Married Filing Jointly |
Married Filing Separately |
Head of Household |
|---|---|---|---|---|
|
10% |
$0-$9,325 |
$0-$18,650 |
$0-$9,325 |
$0-$13,350 |
|
15% |
$9,326- |
$18,651- |
$9,326- |
$13,351- |
|
25% |
$37,951- |
$75,901- |
$37,951- |
$50,801- |
|
28% |
$91,901- |
$153,101- |
$76,551- |
$131,201- |
|
33% |
$190,651- |
$233,351- |
$116,676- |
$212,501- |
|
35% |
$416,701- |
$416,701- |
$208,351- |
$416,701- |
|
39.6% |
$418,401 |
$470,701 |
$235,351 |
$444,551 |
Table by author. Data source: IRS.
To use the 2017 brackets to figure your tax requires some extra work. For instance, say a married couple filing jointly has taxable income of $50,000. The 2017 tax on the first $18,650 will be 10%, working out to $1,865 in tax. Then, take the remaining income above that amount, $50,000 minus $18,650, or $31,350. That gets taxed at 15%, producing $4,702.50 in tax. Add those two amounts together, and you get total tax of $6,567.50.
Note that when the actual 2017 tax table comes out, the number will be slightly different. The IRS tax tables are based on the tax near the middle point of the income range for each particular row. Therefore, you can end up owing slightly more or less depending on where in the income range you fall. However, with the ranges only being $25 to $50 wide, that won't produce a major difference in your tax liability.
For now, the 2017 tax tables that you'll use to pay taxes in 2018 aren't available. However, you can get an estimate of your tax by using the tax brackets above. That will help you plan well ahead for what you'll owe over the coming year.
The $15,834 Social Security bonus most retirees completely overlook If you're like most Americans, you're a few years (or more) behind on your retirement savings. But a handful of little-known "Social Security secrets" could help ensure a boost in your retirement income. For example: one easy trick could pay you as much as $15,834 more... each year! Once you learn how to maximize your Social Security benefits, we think you could retire confidently with the peace of mind we're all after.Simply click here to discover how to learn more about these strategies..
Try any of our Foolish newsletter services free for 30 days. We Fools may not all hold the same opinions, but we all believe that considering a diverse range of insights makes us better investors. The Motley Fool has a disclosure policy.