Company Overview: wells fargo & co. - WFC
WFC Key Data
| Open $81.89 | Day Range 81.62 - 82.64 |
| 52 Week Range 72.78 - 97.76 | Market Cap $242.71B |
| Shares Outstanding 3.02B | Public Float 3.02B |
| Beta 0.95 | Rev. Per Employee N/A |
| P/E Ratio 11.66 | EPS $6.97 |
| Yield 225.53% | Dividend $0.50 |
| EX-DIVIDEND DATE Aug 7, 2026 | SHORT INTEREST N/A |
| AVERAGE VOLUME 14.18M |
Wells Fargo & Co. in the News
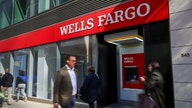
Wells Fargo becomes first major bank to relocate wealth operations headquarters to Florida
Wells Fargo tells Fox News Digital that its relocation to West Palm Beach is a "strategic commitment" to serving high-net-worth clients by increasing the wealth branch's reach in Florida.

Why major financial firms are expanding Texas presence beyond traditional Wall Street hub
Major financial services firms such as Goldman Sachs, JPMorgan Chase, and Wells Fargo have expanded operations in Dallas, Texas, where the firms have thousands of workers.

JPMorgan lifts interest income forecast after profit beats estimates
JPMorgan Chase CEO Jamie Dimon says the U.S. economy remains resilient despite geopolitical uncertainty as the bank beats quarterly profit forecasts.

Big bank CEOs weigh in on Trump's tariffs: 'Considerable turbulence'
The CEOs of two major U.S. banks discussed President Donald Trump's tariffs in letters within their quarterly earnings reports and said that the duties could slow the economy.
Big bank CEOs to meet with lawmakers on solutions to debanking
A group of CEOs from leading U.S. banks are meeting with the Senate Banking Committee to discuss potential solutions to regulatory issues related to debanking decisions.

Trump's Davos comments reignite debanking controversy
President Donald Trump accused leading U.S. banks of debanking conservative clients over their political views, a claim that financial institutions have pushed back on.

California wildfires: Insured losses could top $30B, Wells Fargo analysis finds
Financial analysts at Wells Fargo Securities estimated that insured losses from the Southern California wildfires could exceed $30 billion based on their latest analysis.

Bank of America profit drops on lower interest income, outlook lifts shares
Bank of America earned $6.9 billion, or 83 cents per share, in the quarter ended June 30, compared with $7.4 billion, or 88 cents per share, a year earlier.
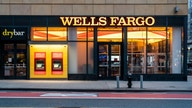
Wells Fargo fires more than a dozen employees for faking work: report
More than a dozen Wells Fargo employees found themselves out of a job last month after the bank investigated allegations of "simulation of keyboard activity."

Conservative group takes aim at Wall Street in report claiming big banks have undercut firearms industry
The American Accountability Foundation has released a report on how big banks have refused to lend money to firearm and ammunition manufacturers in an "asymmetrical attack" on the firearms industry.